Foreclosure of a Dream

With so many Gen Zers moving into the work force and establishing long term careers, their focus starts to shift to the next symbol of adulthood – owning a home. What they are finding is a crash course in housing supply and demand coupled with the highest mortgage rates we have seen since the year 2000. If you managed to escape the pandemic with your job intact, you could consider yourself lucky, but the effects of the pandemic have been persistent and evolving in ways that no one could have predicted. Home prices have skyrocketed, wage growth has been snuffed out by rampant inflation, and the dream of one day owning a home seems more elusive with each passing year. But the issue of home affordability did not start with the pandemic. In fact, we can look to historical data to reveal how the housing market has evolved over many years.
To analyze home prices over a period of time there are a number of different tools that can provide useful data. But perhaps the most respected barometer used by economists is the Case-Shiller Index. The index tracks the sale price of single-family homes nationwide that have successive arms-length sales of the same house. In the beginning of 2000, the median sales price of a single-family home was around $165,300. According to the Case-Shiller, home prices have increased 212% since 2000, with the fastest increase occurring since the start of the pandemic in 2020. Despite the housing market crash in 2008, a $165,300 home in the year 2000 would place the current value at just over $350,000. This is hard to contextualize because inflation pushes all prices upward so let’s break this down in terms of income.
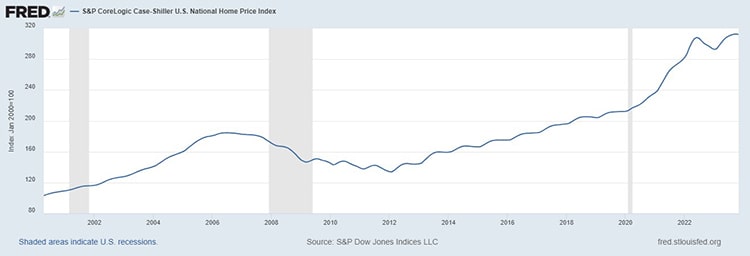
https://fred.stlouisfed.org/series/CSUSHPINSA
Specifically, we look at how much home can you afford, based on your income level. One rule of thumb commonly used by financial advisors is the 2.5 rule. This rule suggests that the maximum home price to consider should not exceed 2.5 times your annual gross income. This means that to afford a $350,000 dollar home in 2023, you would need about $140,000 in income to live comfortably while paying your mortgage. The problem is that the real median household income in the U.S. for 2022 (the last full year of data that was released) was only $74,580 and it is likely to remain stagnant in 2023 due to high inflation, which has superseded wage growth since 2020.
The reality of the situation is that homes are costing around 4.7 times what they should relative to median household income, making homeownership seem like a fleeting dream. Comparing year 2000’s real median household income of $42,148 to the 2022 number above, you get an increase of only 77%. If you further compare that to the 220% price increase of homes since 2000, the picture becomes clearer -- wages have not grown nearly enough to afford the exorbitantly high home prices of today’s real estate market.
It is not all doom and gloom though. In 2022 we saw home prices start to decline for the first time in years and while home prices have rebounded, it seems they are slowing once again. There is less competition as a result of higher mortgage rates, providing an opportunity for first time buyers to negotiate prices and potentially secure a home that fits within their budget, even if it’s not the home they pictured owning.
Meet Matt Armendaris, Associate Financial Planner »
IMPORTANT DISCLOSURES
West Financial Services, Inc. (“WFS”) offers investment advisory services and is registered with the U.S. Securities and Exchange Commission (“SEC”). SEC registration does not constitute an endorsement of the firm by the SEC nor does it indicate that the firm has attained a particular level of skill or ability. You should carefully read and review all information provided by WFS, including Form ADV Part 1A, Part 2A brochure and all supplements, and Form CRS.
Certain information contained herein was derived from third party sources, as indicated, and has not been independently verified. While the information presented herein is believed to be reliable, no representation or warranty is made concerning the accuracy of any information presented. Where such sources include opinions and projections, such opinions and projections should be ascribed only to the applicable third party source and not to WFS
This information is intended to be educational in nature, and not as a recommendation of any particular strategy, approach, product, security, or concept. These materials are not intended as any form of substitute for individualized investment advice. The discussion is general in nature, and therefore not intended to recommend or endorse any asset class, security, or technical aspect of any security for the purpose of allowing a reader to use the approach on their own. You should not treat these materials as advice in relation to legal, taxation, or investment matters. Before participating in any investment program or making any investment, clients as well as all other readers are encouraged to consult with their own professional advisers, including investment advisers and tax advisers.