Gauging Forward Return Expectations

During the depths of the pandemic, work from home businesses were, undoubtedly, huge beneficiaries of consumer demand for their services and products. First-order thinking was rewarded during this period, as investments into these stocks appreciated handsomely. While we experienced some uprooting of our lives and the impact of rapid change, West Financial was also brainstorming ways to intelligently invest in long-term COVID-winners. Exercise equipment manufacturer and subscription service, Peloton Interactive Inc. (PTON), was at the epicenter of this craze (I even got my own bike during this time!). In this article, we will share how we most effectively utilized our research time, by inverting the Total Shareholder Return Framework. These principles are helpful in framing future performance expectations heading into an investment.
Total Shareholder Return (TSR) = Growth + Multiple Change + Dividend
Looking backwards, we know the inputs and can further break them down into more parts, if desired. Looking forward, we start by assuming an imaginary hurdle rate, or required return on investment. For Peloton, the question posed was, “will an investment in the stock yield our clients a 10%+ annual return over the next 5 years?”
Going back to elementary algebra, the right hand side of the equation needs to match the left side, using any combination of inputs. One path is that the business can grow 10% per year, with no change in investor sentiment (price multiple), and no dividend payments. You can achieve the same result if a business does not grow, but pays out 10% per year in dividends, leaving the multiple unchanged.
With the required return and time frame specified, the next step is to analyze the financial data. Going back to Peloton’s June 30th, 2020 annual report, the market cap, or company value of $16.6B was 9-times higher than the annual sales of $1.8B. Said another way, the price-to-sales (P/S) multiple was a bit higher than 9x and the company also did not pay a dividend. Here is what we have so far:
10% = Growth + Multiple (~9x) + Dividend (0%)
Now… I did not blindly pass over a very important variable! We are going plug & play with various growth assumptions. Assuming a 10% annual return over the next 5 years, the company value would be ~$26.8B. The table below shows estimated multiples, often called terminal multiples, 5-years into the future. Using this information we back into the implied sales growth necessary to generate our required return. As you can see, if the multiple does not change, growth will need to be around 10% to generate a 10% return. As the multiple contracts, the annual growth needed increases.

Source: West Financial Analysis, SEC.gov
This general guidepost shows us various return paths that PTON could take. In January of 2021, valuation hit a peak of almost 25x sales, inflating the market cap to almost $50B and making the company larger than two-thirds of the S&P 500 at the time. Comparatively, the S&P 500 has an average Price/Sales of about 2x over the past 10 years. For sake of example, if PTON traded at a market multiple in 5 years, the company would need sales of around $13B (47.4% annual increases from $1.8B) to earn a 10% return annually. How feasible is this? According to the Base Rate Book, historical data tells us that only ~1% of companies from 1950-2015 have ever grown sales >45% annually over a 5-year time horizon.
In hindsight, we were fortunate to avoid adding Peloton to the portfolios, but plenty of investors get caught up in the hype and extrapolate results well beyond reality. Others may be playing a different game, focusing on a shorter time horizon. Just a couple years later, PTON now trades at ~1x sales with the market capitalization below pre-pandemic levels, nearing $3 billion.
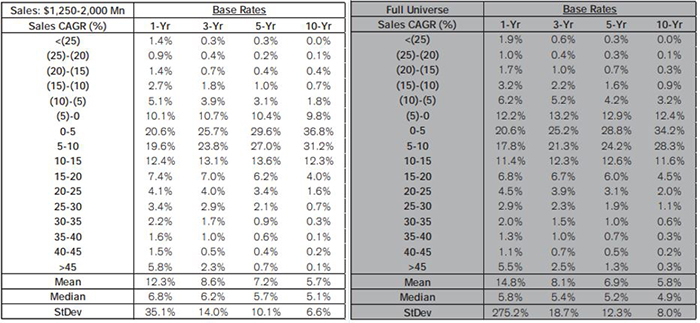
Source: The Base Rate Book
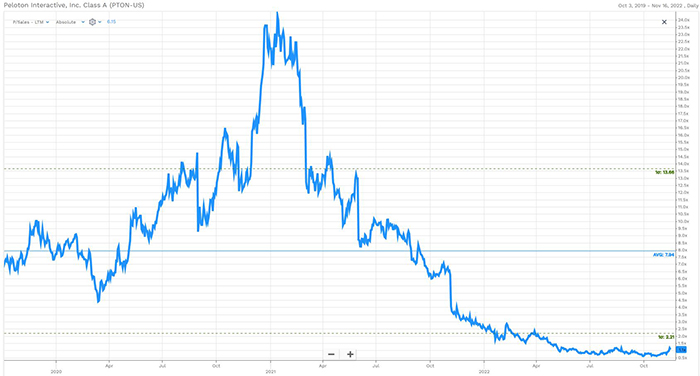
Source: FactSet Database
The TSR framework focuses West Financial on the long-term and shines a light on the potential end results by illustrating the magnitude that sentiment (multiple) changes have on growth expectations. The framework also focuses our analysis on fundamental value drivers. Once the due diligence process is completed, we can also use this framework to help compare different investment opportunities in a portfolio.
Bonus points if you made it this far. As an additional perspective, the graphic below does a great job explaining this concept with real world examples. The chart shows the P/E that an investor could have paid in 1973 in order to achieve a 7% compound annual return over the next 46 years (to 2019). Companies can indeed provide decent returns when purchased at high valuations, but the margin of safety is quite low due to the persistence & longevity of growth.
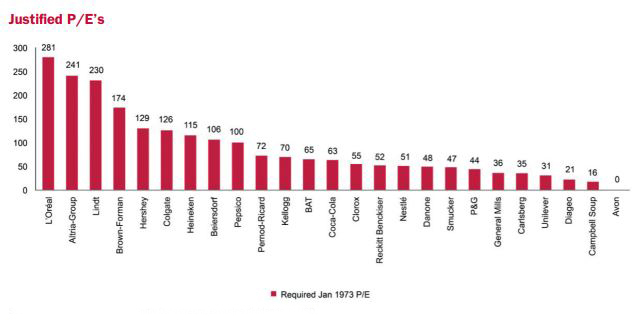
Source: Fundsmith
Additional Resources:
- The Base Rate Book
- Future - When Entry Multiples Don't Matter
- Verdad - What's in an Equity Return?
- SEC.gov
Read the Financial Planning Focus November 2022:
"The Year End Gift You May Not Be Expecting" by Brian J. Horan, CPWA® »
"Recessions and the Stock Market" by Glenn Gaurd, CFA »
Important Disclosures
- West Financial Services, Inc. (“WFS”) offers investment advisory services and is registered with the U.S. Securities and Exchange Commission (“SEC”). SEC registration does not constitute an endorsement of the firm by the SEC nor does it indicate that the firm has attained a particular level of skill or ability. You should carefully read and review all information provided by WFS, including Form ADV Part 1A, Part 2A brochure and all supplements, and Form CRS.
- Certain information contained herein was derived from third party sources, as indicated, and has not been independently verified. While the information presented herein is believed to be reliable, no representation or warranty is made concerning the accuracy of any information presented. Where such sources include opinions and projections, such opinions and projections should be ascribed only to the applicable third party source and not to WFS.
- This information is intended to be educational in nature, and not as a recommendation of any particular strategy, approach, product, security, or concept. These materials are not intended as any form of substitute for individualized investment advice. The discussion is general in nature, and therefore not intended to recommend or endorse any asset class, security, or technical aspect of any security for the purpose of allowing a reader to use the approach on their own. You should not treat these materials as advice in relation to legal, taxation, or investment matters. Before participating in any investment program or making any investment, clients as well as all other readers are encouraged to consult with their own professional advisers, including investment advisers and tax advisers.