International Equity — Are the Glaciers Melting?
Investors have waited over 11 years for international stocks to take the lead from U.S. stocks. While the shift is occurring at a glacial pace for long-term investors, waiting for change is not an appropriate strategy. To improve a portfolio’s return profile, investors need to have active and selective exposure to investment opportunities outside the U.S.
International equities have underperformed the U.S. since the Great Financial Crisis. Since March 2009, the S&P 500 returned 434% cumulatively, or 16% annualized. International equities have been frozen out of the leadership spot, returning just under 9% annually - respectable but lagging.
Long-term investors look for leadership outperformance of at least 18-24 months. While international stocks outperformed the U.S. in certain 6 and 12 month “iceberg summers,” such as 2017, the U.S. went on to dramatically outperform for the next two years.
The current period of international underperformance is the longest in MSCI index history. The post-modern industrialization of Japan and a strong yen were major drivers of international equities in the 1970s and 1980s. Specifically, in the 5-year period leading to the Nikkei peak in 1989, U.S. investors who indexed Japanese equities returned 466% cumulative, or 41.5% annualized. Well over half of the return was yen currency appreciation against the U.S. dollar.
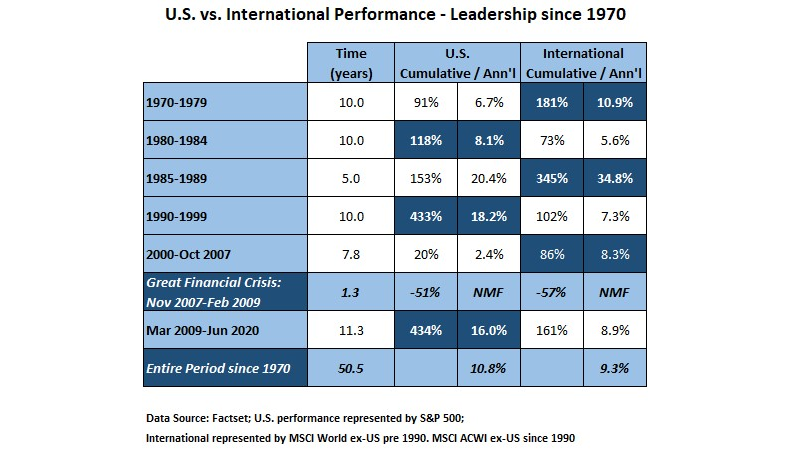
At the end of the 20th century, after the U.S. had led the world at such a fast pace, few investors expected that international equity would then dominate from 2000-2007. Emerging markets, a global commodity boom and a dollar decline led during that period. While international equity returned 86%, emerging markets specifically rose 235% — a whopping 16.7% annualized. Meanwhile, S&P investors only received 2.3% annualized over close to eight years, while “China” and “BRIC” investing became the new craze.
By contrast, international indexing has not offered the same outsize returns, especially during long periods of U.S. leadership. Simply having broad exposure to most stocks in 30-50 countries is a sub-par and overly diversified solution. Carefully curating active international and emerging managers can improve overall portfolio performance and avoid many “go nowhere” stocks.
What is a go nowhere stock? In many countries, a large number of public companies have been run for the government or large family “stakeholders” — not in the best interest of foreign shareholders from the U.S. For example, the well-known international index, MSCI EAFE (developed markets in Europe and Asia Pacific) has a large weighting to European and Australian Banks. Some large European banks have been called “zombie banks,” like those in Japan in the 1990s and 2000s — not run for maximum shareholder wealth, but to satisfy a wide range of stakeholders.
Having a moderate international allocation will likely help if the U.S. growth and technology leadership falters; some investors believe these stocks are skating on thin ice, like in 1999. However, secular trends are hard to change (COVID withstanding) and the U.S. may extend its unprecedented leadership to 12 or 13 years. It doesn’t matter whether the international glaciers are melting. We recommend being armed with a robust international equity strategy, involving highly selective investments to complement a core U.S.-centric portfolio.
Meet Dan Trosch, CFA® »
Read the Financial Focus August 2020:
- "Expect the Best, But Plan for the Worst" By Cheryl Langston, CFP® »
- "Signal From Noise: Introducing the Total Shareholder Return Framework" By Ryan Streilein, CFA® »
- "Master of My Domain" By Kristan L. Anderson, CEBS, CFP® »
Important Disclosures
-
West Financial Services, Inc. (“WFS”) offers investment advisory services and is registered with the U.S. Securities and Exchange Commission (“SEC”). SEC registration does not constitute an endorsement of the firm by the SEC nor does it indicate that the firm has attained a particular level of skill or ability. You should carefully read and review all information provided by WFS, including Form ADV Part 1A, Part 2A brochure and all supplements, and Form CRS.
-
Certain information contained herein was derived from third party sources, as indicated, and has not been independently verified. While the information presented herein is believed to be reliable, no representation or warranty is made concerning the accuracy of any information presented. Where such sources include opinions and projections, such opinions and projections should be ascribed only to the applicable third party source and not to WFS.
-
This information is intended to be educational in nature, and not as a recommendation of any particular strategy, approach, product or concept. These materials are not intended as any form of substitute for individualized investment advice.
;