Investment Management - First Quarter 2019
We provide a copy of our investment management letter, without enclosures, to keep you up-to-date on the investment markets and West Financial Services.i
The Greatest of All Time
In recent years, a certain 41-year-old New England quarterback has had his playing ability scrutinized by fans who try to call the “top” of his game. Similarly, with this economic expansion any slowdown in economic growth causes financial pundits to predict the “top” of the cycle – as they did in December. As we have discussed before, economic expansions – and apparently the careers of New England quarterbacks – just do not die of old age.
The S&P 500 rebounded strongly from the December 24th lows, rallying 20.5% from the 24th through the end of the first quarter. This major shift in risk appetite occurred as the Federal Reserve (the Fed) pivoted from their hawkish tone and investors began to look past the slowdown in first quarter earnings and economic growth. The end of the government shutdown in January and the positive momentum in trade negotiations with China also lifted investor optimism through the first quarter of 2019.
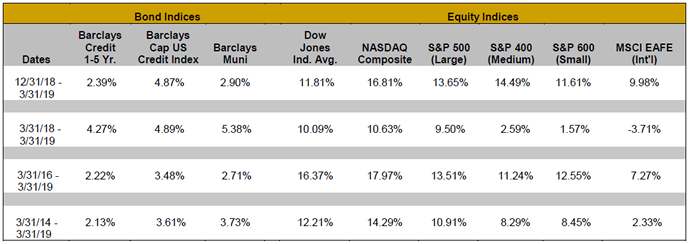
For the first three months of 2019, the S&P 500 returned 13.7%. Mid and small capitalization companies, represented by the S&P 400 and S&P 600, returned 14.5% and 11.6%, respectively. International stocks, which are tracked by the MSCI EAFE, underperformed their domestic counterparts returning only 10.0% as economic growth has been weaker abroad.
Performance provided by Morningstar for various indices for the three-month (not annualized), one-year, three-year and five-year periods appears below:
While the rebound in equities was substantial, there are still a few conflicting signals from the global economic backdrop. Most importantly, the global expansion remains unbalanced. A few European countries are experiencing flat economic conditions, while the U.S. and China maintain positive, albeit slower growth rates compared to 2018. The economic data released thus far in 2019 reflects this unbalanced expansion both regionally and within different industries. Manufacturing has improved in the U.S. and China, while Eurozone numbers trended lower. Regional service sector Purchasing Managers’ Indices (PMI), on the other hand, have continued to outpace manufacturing and are supportive for growth around the globe.
Concerns about a profit recession, similar to the one we experienced late in 2015 and early 2016, are receding, but will be dependent on guidance issued during the first quarter earnings season. While first quarter earnings-per-share (EPS) for the S&P 500 are expected to fall, full-year 2019 EPS growth is expected to be 3.7% on a revenue increase of 5%. Slower bottom-line growth, mainly from global companies in technology, energy and material sectors, is dragging down the overall rate. Companies are also beginning to experience margin pressure from the tight labor market. Overall, low single digit wage increases are helping U.S. consumers to increase spending – a big tailwind for the U.S. economy where consumer spending is close to 70% of GDP.
Another mixed signal was a slight, and temporary, inversion of the Treasury yield curve, which occurs when the yield on a 10-year Treasury falls below the yield of a three month T-bill. An inverted yield curve, last seen in 2007 and an indicator economists pay particular attention to, has predated the last seven recessions. However, an inverted yield curve does not guarantee a recession, only that bond investors think the Fed will cut rates rather than raise them.
Long-term bond yields have fallen globally as central banks indicate they are willing to hold rates lower for longer. German 10-year bonds have fallen into negative territory and Japanese bonds are at the lowest levels in more than two years. Bond prices generally react to anticipation of inflation. Here in the U.S., inflation has yet to match the Fed’s target of 2% for seven straight years.
At its March meeting, the Federal Open Market Committee (FOMC) stated it would be “patient” when evaluating further rate increases. Along with this new patient stance, the newly released dot-plot, which shows where the FOMC members think rates will be in the short, medium and long run, changed to show no anticipation of any rate increases in 2019. In the aftermath, the yield on the 10-year Treasury fell as low as 2.34%, a level not seen in 15 months. Prior to the meeting, the yield was 2.61%. Traders almost immediately began pricing in a rate cut in 2019. Fed fund futures are now pricing in a 57% chance of a 25 basis point rate cut towards the end of 2019.
With the Fed having stepped back, we remain positive on the economic cycle continuing, though we will monitor macro risks, such as Brexit. We see a balance between risk and reward in equities as stocks approach their all-time highs and valuations appear fair. Therefore, we plan to slightly reduce equity positions. This will provide cash in order to be opportunistic should we experience any short-term corrections. For our managed bond ladders, we plan to keep the majority of purchases within eight years. Should opportunities emerge for attractive yields going out slightly longer on the yield curve we may purchase those bonds – both corporate and municipal.
We would like to welcome our newest employee, Kris Roche. Kris joined West Financial in March as a client service associate. Kris is a recent graduate of George Mason University with a BS in Finance and Management.
Go Green! The fastest, most secure way to receive your WFS quarterly statement is through our client portal. Over 65% of our clients have elected to receive West Financial documents electronically, reducing processing times, paper waste, and postage. With the recent tax law changes, there are likely changes in your tax filing. Using our client portal, you can securely upload your tax documents for our review.
In conjunction with our client portal, we are now providing e-Signature services for many typical requests. Our client service associates have been trained in new processes that allow us to complete many of your requests electronically, including money movement, beneficiary updates, transfers, account openings, and more! Since e-Signature has been in place, we have experienced a faster turnaround in paperwork processing with the custodians. If you wish to have guidance for use of the portal, or a demonstration of e-Signature, please contact your client service associate.
West Financial was named by InvestmentNews as one of the “Best Places to Work for Financial Advisers.”ii This is our second year in a row to receive this recognition. We know that client service and a healthy, caring and supportive work environment go hand in hand.
In accordance with SEC regulations, we must provide or offer to provide all clients with Form ADV Part 2A, our disclosure brochure, in the event of any material changes and no less than on an annual basis. Accordingly, we are providing copies of our disclosure brochure and supplement (Form ADV Part 2B) for your records. Our current Form ADV Part 2A is also available on our website (www.westfinancial.com), the SEC’s website (www.adviserinfo.sec.gov), or can be provided to you upon request.
Enclosed you will find your portfolio dated March 31, 2019. We provide performance numbers for the quarter, one-year, three-year and five-year periods, where applicable. Should you have any questions regarding your portfolio, or any financial planning related questions, please call us at any time. Thank you for your continued confidence in West Financial and please do not hesitate to refer friends, family or co-workers who you feel may benefit from our services. In our 37th year of service, we remain committed to putting our clients first, providing honest communication and transparency, and to providing proactive, accessible and flexible service. Don’t hesitate to let us know how we are doing and ways in which we can help meet your financial needs.
|
President
|
Chief Investment Officer
|
Director of Fixed Income
|
|---|---|---|
 |
 |
 |
| Glen J. Buco, CFP® | Glenn Robinson, CFA | Norma Graves, CFP® |
'West Financial Services, Inc. offers investment advisory services and is registered with the U.S. Securities and Exchange Commission (“SEC”). SEC registration does not constitute an endorsement of the firm by the SEC nor does it indicate that the firm has attained a particular level of skill or ability. The information contained herein does not constitute investment advice or a recommendation for you to purchase or sell any specific security. You are solely responsible for reviewing the content and for any actions you take or choose not to take based on your review of such content.
Certain information contained herein was derived from third party sources as indicated. While the information presented herein is believed to be reliable, no representation or warranty is made concerning the accuracy of any information presented. We have not and will not independently verify this information. Where such sources include opinions and projections, such opinions and projections should be ascribed only to the applicable third party source and not to West Financial Services, Inc.
Certain statements herein reflect projections or opinions of future financial or economic performance. Such statements are “forward-looking statements” based on various assumptions, which may not prove to be correct. No representation or warranty can be given that the projections, opinions, or assumptions will prove to be accurate.
iThe S&P 500 Index, the S&P 400 Index, the S&P 600 Index, the MSCI EAFE Index, the Barclays Credit 1-5 Year Index, the Barclays Cap U.S. Credit Index, the Dow Jones Industrial Average, and the NASDAQ Composite (each, an “Index”) is an unmanaged index of common stocks that is used as a general measure of security market performance, and its performance is not reflective of the performance of any specific investment. The Index comparisons are provided for informational purposes only and should not be used as the basis for making an investment decision. Further, the performance of your account and each Index may not be comparable. There may be significant differences between your account and each Index, including, but not limited to, risk profile, liquidity, volatility and asset comparison. The performance shown for each Index reflects no deduction for client withdrawals, fees or expenses. Accordingly, comparisons against the Index may be of limited use. Investments cannot be made directly into an Index.
iiIn order for firms to be considered for InvestmentNews’ list of Best Places to Work for Financial Advisers, they must meet the following criteria: (1) Be a registered investment adviser or an affiliated independent broker-dealer; (2) Be in business a minimum of one year and (3) Have at least 15 employees. Then they must register with INBestPlacestoWork.com and complete a survey that asks questions about the firm's working environment, benefits, company culture and other key areas. The survey was developed by an outside consultant with the input of InvestmentNews and leading industry executives. Once the survey is completed, employees will be invited to fill out a survey that will get at what they really love about working at the participating firm. Their consultant will then independently combine the two surveys to come up with a final score that will determine whether the firm will be named one of the Best Places to Work for Financial Advisers. Firms do not pay a fee to be considered or placed on the final list of Best Places to Work for Financial Advisers. The only cost is to allow participating firms to view the employee feedback reports.