Investment Management - Fourth Quarter 2020
We provide a copy of our investment management letter, without enclosures, to keep you up-to-date on the investment markets and West Financial Services.i
The New, New, New, New Normal
What is normal these days? Investors just witnessed one of the strangest years on record, which included a global pandemic, a 35% decline for the S&P 500, negative oil prices, and the discontinuation of handshakes. Now, as vaccinations are distributed, and the world is awash with monetary and fiscal stimulus, equity prices have roared back and are trading at all-time highs. However, while most people cannot wait to reconnect with family and friends in person, there is little doubt some daily habits will be forever changed due to COVID-19.
In 2009, as the U.S. economy emerged from the Great Recession, Bill Gross (then at PIMCO) forecast that economic growth over the next ten years would be hindered due to “delevering, deglobalization and reregulation."ii This quote is still apt as tensions between the U.S. and China remain elevated, governments borrow substantial amounts to provide economic relief, and populism spreads. One major difference between then and now is the consumer balance sheet. After the 2008 housing bust, consumers were saddled with debt as household net worth plunged. Broadly speaking, consumers appear to be in good financial shape in this recovery which partially explains the enthusiasm for equity investments.
In the fourth quarter, the total return for the S&P 500 was 12.2%. Mid and small capitalization stocks, represented by the S&P 400 and S&P 600, soared 24.4% and 31.3%, respectively. International stocks also outperformed the S&P 500, rising 16.1%, assisted by the rebound in cyclical stocks and a weaker U.S. dollar.
Performance for various indices for the three-month (not annualized), one-year, three-year and five-year periods appears below:
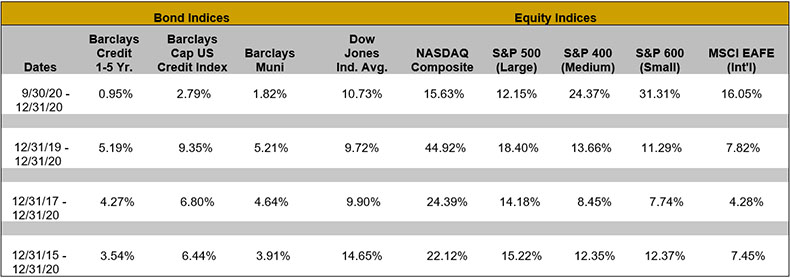
It is notable that over the last three months of the year, cyclical companies, including banks and industrials, outperformed, as did small capitalization stocks. A dramatic change from earlier in the year. Revenue growth of these cyclical companies is more sensitive to the economy, suggesting that investors believe the economic recovery is strengthening and gaining momentum. Full-year 2020 equity performance, however, will be remembered for the acceleration of several secular trends — online shopping, cloud infrastructure and software applications, and the dramatic outperformance of technology stocks. These trends were further highlighted by a population stuck at home and separated from their family, friends and normal routines.
Turning to fixed income markets, what is the new, new normal for interest rates? The yield on the 10-year Treasury reached 1% for the first time since March, after falling to a new record low yield of 0.52% over the summer. Even with paltry yields, the U.S. bond market remains attractive worldwide. The amount of negative yielding debt has climbed to a record of $18 trillion, which translates to 27% of the world’s investment grade debt. It looks like low rates are here to stay for the foreseeable future. The Federal Open Market Committee (FOMC) has stated that the benchmark fed funds rate will remain at 0% at least until 2023. According to Bloomberg, benchmark rates in several countries will be cut even further. The Fed’s bond buying program ($120 billion per month) is helping to keep interest rates artificially low while the economy recovers.
As one of the drivers behind higher interest rates, inflation remains tame. The Federal Reserve’s job with monetary policy is to aim for maximum employment and price stability. The Fed has altered their inflation goal from just targeting 2%, to “likely aim to achieve inflation moderately above 2% for some time.”iii This change resulted from their inability to reach their 2% target during the last expansion. However, the Fed has yet to disclose how they will achieve 2% inflation. We should also note that the breakeven point between conventional Treasuries and Inflation Protected Treasuries has reached 2% (implying 2% inflation over the next 10 years) for the first time since 2018.
A benefactor of low rates has been the housing industry, with the average 30-year mortgage rate at 2.86% and existing home sales up 25.8% from a year ago. Also, lower rates have allowed corporations to refinance debt. Many of our corporate bonds are being called early while municipal bonds are being defeased, or having funds escrowed to pay the bonds off early.
Economists enjoy using letters to project the shape and rate of an economic recovery, with the usual being “V,” “U,” and or “W.” Many have noted that the current recovery is more “K-shaped,” as the differences between the haves and have-nots are widening. Many with higher paying jobs have been able to telework while lower paying jobs in the service industry have been decimated. The jobless rate now stands at 6.7% with many jobs never to return. At the same time, the personal savings rate in November was 12.9%, well above the 7.5% rate a year ago. With the recent additional $900 billion of stimulus starting to flow into our economy and pent-up demand from consumers, the tide should turn towards greater household spending.
For our client portfolios, low yields are one factor keeping equities attractive relative to fixed income. The appreciation of stock prices last year has increased the overall valuation for stocks, though specific large technology companies were mainly responsible. Higher valuations and higher interest rates can make stocks more susceptible to volatility. At the same time, high equity valuations are not always an indicator of a bubble in the stock market. Valuations may contract if economic growth is better than forecast and interest rates remain stable. Understanding these risks, and matching them with your overall financial situation and risk tolerance, are key factors in our allocation decisions.
We also repeat our mantra that fixed income always has a place in a diversified portfolio. Yields are not zero and certainly higher than cash investments. By building a bond ladder, these lower yielding bonds will eventually “roll off” leaving funds for disbursements and potentially the purchase of higher yielding investments in the future. However, we are looking at “new rungs,” or additions, to the fixed income portion of portfolios. While our fixed income philosophy continues to have a focus on individual bonds, we are adapting to current market conditions. Many portfolios will see purchases of bond funds which allows for additional diversification and slightly higher yields than we may get with an individual bond purchase. Also, for some accounts we are purchasing preferred stock and hybrid preferred stock. Due to the volatility of prices and uncertainty of returns, these buys will be in limited amounts and are client specific.
Enclosed you will find your portfolio appraisal as of December 31, 2020. We have provided performance numbers for the quarter, one-year, three-year and five-year periods, where appropriate. The custodian where your account is held will be sending Form 1099-DIV (dividends) and 1099-INT (interest) information to you directly. Also, the Form 1099-B will provide a record of realized gains and/or losses in taxable account(s) as well as any management fees paid directly from your brokerage account(s).
In addition to your statements, your packet will include any restrictions that you have placed on your account. Please review these and contact us should there be any changes. Also, now would be a good time to review your asset allocation and risk tolerance. If you have had any changes to your income, marital status, state of residence, tax bracket, etc., please be sure to let us know.
In October, Kim Cox and Matt Cohen were recognized as Five Star Wealth Managers by Five Star Wealth Professionals.iv To follow, Kim appeared in the Women in Wealth special section of the November 2020 issue of Fortune magazine as a Five Star Wealth Manager winner.v
As West Financial Services enters its 39th year, now with 35 employees, and almost $2 billion in assets under management, we would like to thank you for recommending our firm and your continued confidence in our investment management and financial planning services. We wish all of you and your families a happy, safe, and prosperous 2021. Should you have any questions regarding your portfolio or financial plans, please do not hesitate to contact us at any time.
|
President
|
Chief Investment Officer
|
Director of Fixed Income
|
|---|---|---|
 |
 |
 |
| Glen J. Buco, CFP® | Glenn Robinson, CFA | Norma Graves, CFP® |
iEach of the S&P 500 Index, the S&P 400 Index, the S&P 600 Index, the MSCI EAFE Index, the Barclays Credit 1-5 Year Index, the Barclays Cap U.S. Credit Index, the Barclays Capital Municipal Bond Index, the Dow Jones Industrial Average, and the NASDAQ Composite (each, an “Index”) is an unmanaged index of securities that is used as a general measure of market performance. The performance of an Index is not reflective of the performance of any specific investment. Each Index comparison is provided for informational purposes only and should not be used as the basis for making an investment decision. Further, the performance of your account and each Index may not be comparable. There may be significant differences between the characteristics of your account and each Index, including, but not limited to, risk profile, liquidity, volatility and asset comparison. The performance shown for each Index reflects no adjustment for client additions or withdrawals, and no deduction for fees or expenses. Accordingly, comparisons against the Index may be of limited use. Investments cannot be made directly into an Index.
iiGross, William H. “On the ‘Course’ to a New Normal.” PIMCO, 9/1/09, https://www.pimco.com/en-us/insights/economic-and-market-commentary/investment-outlook/on-the-course-to-a-new-normal/.
iii“FAQs: Why does the Federal Reserve aim for inflation of 2 percent over the longer run?” Board of Governors of the Federal Reserve System, 9/27/20, https://www.federalreserve.gov/faqs/economy_14400.htm.
ivFive Star Professional: Five Star Wealth Managers
The Five Star Professional award program, managed by fivestarprofessional.com, conducts market-specific research throughout the U.S. and Canada to select reputable, specialized, and honest service professionals. Required eligibility criteria: (1) Credentialed as an investment advisory representative or a registered investment advisor; (2) Actively employed as a credentialed professional in the financial services industry for a minimum of five years; (3) Favorable regulatory and compliant history review; (4) Fulfilled their firm review based on internal firm standards; and (5) Accepting new clients. Considered eligibility criteria: (1) One-year client retention rate; (2) Five-year client retention rate; (3) Non-institutional discretionary and/or non-discretionary client assets administered; (4) Number of client households served; and (5) Education and professional designations. Wealth managers do not pay a fee to be considered or placed on the final list of Five Star Wealth Managers.
vFive Star Professional: Women in Wealth Five Star Wealth Managers in Fortune Magazine
The Five Star Wealth Manager Award, administered by Crescendo Business Services, LLC (dba Five Star Professional), is based on 10 objective criteria. Required eligibility criteria: 1. Credentialed as a registered investment adviser or a registered investment adviser representative; 2. Actively licensed as a registered investment adviser or as a principal of a registered investment adviser firm for a minimum of 5 years; 3. Favorable regulatory and complaint history review; 4. Fulfilled their firm review based on internal standards; and 5. Accepting new clients. Additional evaluation criteria considered: 1. One-year client retention rate; 2. Five-year client retention rate; 3. Non-institutional discretionary and/or non-discretionary client assets administered; 4. Number of client households served; and 5. Education and professional designations. Wealth managers do not pay a fee to be considered or placed on the final list of Five Star Wealth Managers. Award does not evaluate quality of services provided to clients.
West Financial Services, Inc. offers investment advisory services and is registered with the U.S. Securities and Exchange Commission (“SEC”). SEC registration does not constitute an endorsement of the firm by the SEC nor does it indicate that the firm has attained a particular level of skill or ability. You should carefully read and review all information provided by WFS, including Form ADV Part 1A, Part 2A brochure and all supplements, and Form CRS. The information contained herein does not constitute investment advice or a recommendation for you to purchase or sell any specific security. You are solely responsible for reviewing the content and for any actions you take or choose not to take based on your review of such content.
This information is intended to be educational in nature, and not as a recommendation of any particular strategy, approach, product or concept. These materials are not intended as any form of substitute for individualized investment advice. The discussion is general in nature, and therefore not intended to recommend or endorse any asset class, security, or technical aspect of any security for the purpose of allowing a reader to use the approach on their own. Certain information contained herein was derived from third party sources as indicated. While the information presented herein is believed to be reliable, no representation or warranty is made concerning the accuracy of any information presented. We have not and will not independently verify this information. Where such sources include opinions and projections, such opinions and projections should be ascribed only to the applicable third party source and not to West Financial Services, Inc.
Certain statements herein reflect projections or opinions of future financial or economic performance. Such statements are “forward-looking statements” based on various assumptions, which may not prove to be correct. No representation or warranty can be given that the projections, opinions, or assumptions will prove to be accurate.