Investment Management - Second Quarter 2019
We provide a copy of our investment management letter, without enclosures, to keep you up-to-date on the investment markets and West Financial Services.i
Lunar Landing - 50th Anniversary
On July 20, 2019, America will celebrate the 50th Anniversary of the first lunar landing. It was the Apollo 11 mission that took Neil Armstrong and Edwin “Buzz” Aldrin, Jr. to the surface of the moon. This event remains one of the culminating moments of the space race, one that demonstrated American ingenuity and achievement. Similar to the Saturn V rockets that launched the Apollo missions, asset prices soared in the first half of 2019.
For some perspective, the S&P 500’s 18.5% total return over the first half of the year was partially driven by a rebound from December’s vicious sell-off. Tariffs, trade issues, slowing economic growth, and declining earnings, which contributed to market turbulence, did not destabilize the market during the 1st quarter as many anticipated. In fact, the market substantially recovered and the rebound continued into the second quarter, which added 4.9% to the S&P 500’s first half rise. Also during the second quarter, mid and small capitalization stocks, tracked by the S&P 400 and S&P 600 indices, rose 3.5% and 2.1%, respectively. International stocks rose 4.1%, led by a rebound in European equities, along with a slightly weaker U.S. dollar. Despite the strong results, valuations for broad indices such as the S&P 500 are in-line with historical averages.
Performance provided by Morningstar for various indices for the year-to-date (not annualized), one-year, three-year, and five-year periods appears below:
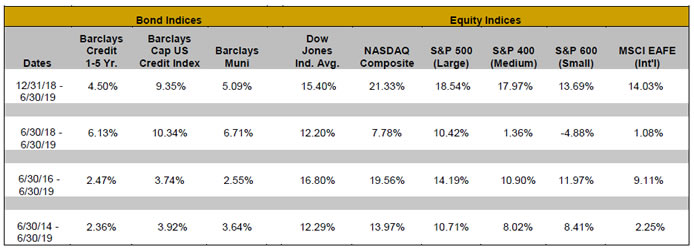
Typically, bond and equity prices are not highly correlated – or simply, they tend to move in opposite directions. Both asset classes appreciated through the first six months of the year, resulting in conflicting signals for investors. As concerns over the global economy increased, some investors sought the safety of fixed income assets, driving up the price of bonds while lowering their yield. At the same time, despite negative revisions in earnings expectations, equity prices benefitted from lower interest rates and global central bank monetary support, rocketing equity prices higher.
While equity prices are higher, corporate earnings in the first half of 2019 are expected to remain flat on a year-over-year basis. Analysts expect improvement in earnings during the second half of 2019, and looking forward to 2020, expect a reacceleration of earnings-per-share (EPS) growth to 12%. In 2018, companies repurchased over $800 billion in stock as part of the windfall from a lower corporate tax rate. A continuation of the trend, after passing the Federal Reserve’s (the Fed) annual stress tests, several banks, including J.P. Morgan, announced large repurchase programs and increased their quarterly dividends. Share buybacks should continue to support the overall market, despite the fact that profit growth has stalled temporarily.
Another concern that market exuberance has taken hold is that Initial Public Offerings (IPOs) are back in style. Several Silicon Valley “unicorns” (private companies worth over $1 billion dollars), are taking advantage of strong equity markets by issuing shares to the public for the first time. While there may be casual similarities to the internet bubble of the late 1990s, including many not yet being profitable, we believe the current group of companies generally have longer operating histories and, as a result, better tested business models.
While the market is climbing skyward, economic growth forecasts are not rocketing. Expectations for global economic growth have trended lower over the past twelve months, mainly due to the uncertainty around global trade, escalating tariffs, and weak manufacturing numbers. The Global Purchasing Managers’ Index for manufacturing slipped below 50, signaling a slight contraction in activity. Domestically, the economic picture is healthier. The recent Institute for Supply Management (ISM) Services Index was 55.1, a solid number, though lower than earlier in the year. Unemployment remains very low, at 3.7%, and wages are rising. This reinforces confidence in domestic consumption, which makes up two-thirds of the overall economy.
Strong demand for fixed income assets drove longer-term yields lower during the quarter. From a high of 2.6% in April, the 10-year Treasury bond briefly touched 1.99% before ending the quarter at 2.00%. When President Trump announced plans in May for tariffs on goods from Mexico, and China announced retaliatory tariffs against the U.S., the decline in yields accelerated. The Treasury yield curve remained inverted throughout the 2nd quarter, with 3-month Treasury bills yielding more than 10-year Treasury bonds. History suggests that if the yield curve stays inverted for a quarter, while far from a sure thing, the probability of a recession over the next 18 months increases.
The Federal Open Market Committee (FOMC) statement released after their June meeting did not include the word “patient” for the first time in five years. It was replaced with a statement that the committee will “closely monitor the implications of incoming information.” Recent comments from Chairman Jerome Powell indicate that the Fed is open to rate cuts, and futures markets expect to see at least one before the year ends. While the FOMC is less concerned about employment conditions at the moment, inflation readings are falling, with the Fed’s preferred measure at 1.6%, below their desired level of 2%.
We continue to make subtle changes within client portfolios, generally managing our investment selections with a long-term timeframe while at the same time being cognizant of short-term volatility. With the decline in interest rates, we are generally pulling back our bond ladders somewhat, purchasing issues maturing in 5 years or less. Since the bond ladders are managed, we are on the lookout for opportunities both in municipal bonds and corporate bonds, where appropriate, so there may be longer maturities purchased from time to time based on the available inventory. In equities, we are generally trimming allocations, given that several indices are close to their all-time highs, and continuing with a bias towards domestic equities over international, and growth stocks over value. Even with the muddled intermediate-term outlook, we remain cautiously optimistic on markets and the U.S. economy.
Welcome to our summer interns, Eli Lerner and Ryan Baillie! Eli is a rising senior at the University of Maryland, and is assisting us with research on equity and fixed income investments. Ryan is a rising senior at the University of Virginia, and is working in our financial planning department to assist with a redesign of our data gathering form and the evaluation of investment options within 401(k) plans, among other projects. Also, Rasti Nikolic has moved from our technology department to financial planning as an associate financial planner. Her specialty is data analysis and she will be assisting and coordinating the collection of client data and helping to develop processes for our different financial planning systems.
We are excited to announce that a West Financial Services, Inc. app is currently under development. The new app will allow you to more easily access your WFS Client Portal, including account information, a vault for secure document sharing, and profiles of WFS team members. Be on the lookout for an announcement once the app launches and let us know if you have any questions or need assistance downloading the app to your mobile phone or tablet.
According to the Environmental Protection Agency (EPA), about 138 million tons of waste ended up in landfills in 2015.ii Of that amount, 13% was paper and paperboard (almost 18 million tons). Join us in doing our part to aid in the reduction of these figures by going green! Our WFS Client Portal is the fastest and most secure way to receive and review your account information. If you have questions about how to change your preferred delivery method for our statements, please contact your relationship manager.
We are pleased to announce that for the fourth time, West Financial Services was recognized in June by the Financial Times as one of the 300 Top Registered Investment Advisorsiii in the U.S. The list recognizes top registered investment advisory firms from across the U.S. based on assets under management, growth rates, years in existence, advanced industry credentials of the firm’s advisers, online accessibility, and compliance records. West Financial Services was also recognized, for the 10th consecutive year, in the July issue of Financial Advisor magazine in their 2019 RIA Ranking by total assets.iv
In mid-June, we hosted a seminar/webinar entitled “Effectively Downsizing – Minimizing to Simplify Life.” We were pleased to have over 50 attendees in total, with insightful comments, questions, and very positive responses. If you would like to receive a copy of the presentation, please contact your relationship manager. We would be happy to share the information and help you work through any decisions you may be contemplating.
Save the date! This year our client appreciation event will be on Thursday, September 19th. We will be entertained by the Fabulous Hubcaps, so break out those dancing shoes! More details will follow in the coming weeks, and we look forward to a fun-filled evening!
Enclosed you will find your portfolio appraisal as of June 30, 2019. We have provided performance numbers for the year-to-date, one-year, three-year, and five-year periods, where applicable. Also enclosed is our annual “Privacy Notice” stating our policy on the confidentiality of client information. If you wish to opt out of sharing information, other than that which is required by law, please complete the form and mail it to West Financial or the Sandy Spring Bank address provided on the form. If you prefer, you may also opt-out by calling the number listed on the Privacy Notice.
Referrals of family, friends, and colleagues who may benefit from financial planning and investment management guidance are always welcome. Thank you for recommending our firm and your continued trust in our financial planning and investment management services.
|
President
|
Chief Investment Officer
|
Director of Fixed Income
|
|---|---|---|
 |
 |
 |
| Glen J. Buco, CFP® | Glenn Robinson, CFA | Norma Graves, CFP® |
i West Financial Services, Inc. offers investment advisory services and is registered with the U.S. Securities and Exchange Commission (“SEC”). SEC registration does not constitute an endorsement of the firm by the SEC nor does it indicate that the firm has attained a particular level of skill or ability. The information contained herein does not constitute investment advice or a recommendation for you to purchase or sell any specific security. You are solely responsible for reviewing the content and for any actions you take or choose not to take based on your review of such content.
Certain information contained herein was derived from third party sources as indicated. While the information presented herein is believed to be reliable, no representation or warranty is made concerning the accuracy of any information presented. We have not and will not independently verify this information. Where such sources include opinions and projections, such opinions and projections should be ascribed only to the applicable third party source and not to West Financial Services, Inc.
Certain statements herein reflect projections or opinions of future financial or economic performance. Such statements are “forward-looking statements” based on various assumptions, which may not prove to be correct. No representation or warranty can be given that the projections, opinions, or assumptions will prove to be accurate.
The S&P 500 Index, the S&P 400 Index, the S&P 600 Index, the MSCI EAFE Index, the Barclays Credit 1-5 Year Index, the Barclays Cap U.S. Credit Index, the Dow Jones Industrial Average, and the NASDAQ Composite (each, an “Index”) is an unmanaged index of common stocks that is used as a general measure of security market performance, and its performance is not reflective of the performance of any specific investment. The Index comparisons are provided for informational purposes only and should not be used as the basis for making an investment decision. Further, the performance of your account and each Index may not be comparable. There may be significant differences between your account and each Index, including, but not limited to, risk profile, liquidity, volatility and asset comparison. The performance shown for each Index reflects no deduction for client withdrawals, fees or expenses. Accordingly, comparisons against the Index may be of limited use. Investments cannot be made directly into an Index.
iii The Financial Times Top 300 (“FT 300”) Registered Investment Advisors is an independent listing produced by the Financial Times. FT 300 assesses registered investment advisers (“RIAs”) on desirable traits for investors. To ensure a list of established companies with substantial expertise, they examine the database of RIAs registered with the U.S. Securities and Exchange Commission and select those that reported to the SEC that they had $300 million or more in assets under management (“AUM”). The Financial Times invited qualifying RIA companies — more than 2,000 — to complete a lengthy application. Some 740 RIA companies applied and 300 made the final list. The formula the Financial Times uses to grade advisers is based on six broad factors and calculates a numeric score for each adviser. Areas of consideration include adviser AUM, asset growth, the company’s age, industry certifications of key employees, SEC compliance record and online accessibility. Neither the RIA firms nor their employees pay a fee to the Financial Times for inclusion in the FT 300.
iv Advisors from across the nation are ranked by total assets under management, growth in assets, assets per client, growth in assets per client and the percentage change in number of clients. Based on a Financial Advisor magazine survey of registered investment advisors who file their ADV statement with the SEC. Only advisors that completed the survey are included in the rankings. Assets under management totals are taken from the firm’s Form ADV. Investor experience/returns were not considered as part of this ranking.