Signal From Noise: Introducing the Total Shareholder Return Framework
Have you ever wondered why a stock goes up? The easiest and most obvious answer is — there are more buyers than sellers! That’s true, but it doesn’t completely answer the question. In truth, any number of factors are at play in the short run. But, in the long run, stock returns ultimately reflect changes in underlying company fundamentals. At West Financial, we seek to align our investment time horizon with your longer-term goals. Using a Total Shareholder Return (TSR) framework, investors often view longer-term returns as a product of three key fundamental drivers that can be measured and analyzed: earnings growth, multiple expansion, and dividends. Understanding these drivers — and their ability to change — can provide valuable insights into your portfolio.
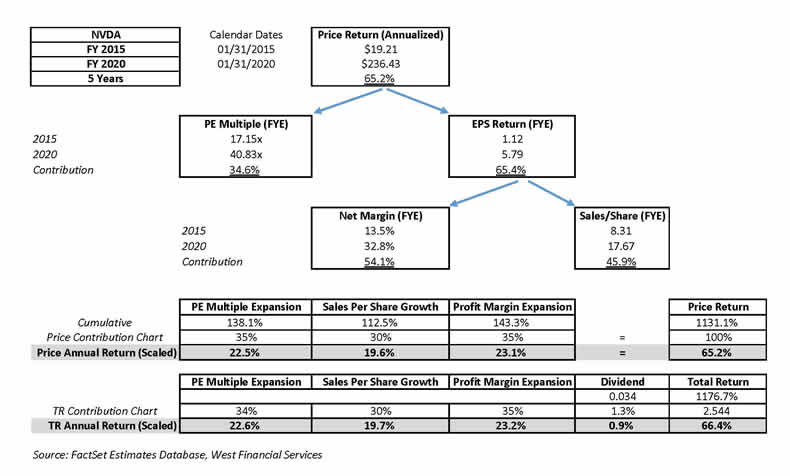
Earnings Growth
Since companies are ultimately valued on their cash flows, growth in earnings is a natural contributor to returns. Earnings growth can be broken into two driving factors: revenue growth and margin expansion. From 2015 through 20201, semiconductor company Nvidia’s earnings-per-share grew 38.9%2 a year, as result of 16.3%2 growth in revenue, and 19.32 percentage point increase in net margin. Thanks in part to that remarkable growth, NVDA shareholders enjoyed a 66.4%3 annualized return over that time.
Investors should consider whether earnings growth is sustainable, particularly for growth significantly above industry averages. Companies selling to expanding markets, or with opportunities for margin improvement, may indeed continue to enjoy robust growth. However, those operating in mature markets, exhibiting higher competition, may be challenged to maintain their historical growth.
Multiple Expansion
Multiple expansion refers to the increase in value investors ascribe to a company’s earnings. Growth in a commonly used metric such as the price-to-earnings (PE) ratio is often a significant contributor to stock returns. A notable example is Proctor & Gamble, which from 2014 to 20191 saw its PE multiple expand from 18.6x to 24.25x2, contributing 53%4 of the total 10.4%3 annualized shareholder return in that time. A myriad of factors influence multiple expansion, but two notable drivers are interest rates and market sentiment. Low or declining interest rates tend to increase multiples, as does bullish market sentiment.
It is important for investors to consider whether multiple expansion is justified. Healthy multiple expansion typically corresponds with improvements in other fundamentals, like a strengthened balance sheet or renewed earnings growth or quality. Unhealthy multiple expansion, in contrast, has little to no fundamental basis and is driven more by overly optimistic sentiment.
Dividends
Dividends are a direct contributor to stock returns — it’s simply the cash portion of that return. Dividends can be a significant return driver for companies that tend to pay out a significant portion of their earnings as dividends, like mature companies or REITs. Take for instance regional utility Dominion Energy, which realized a 5.8%3 return per year from 2014 to 20191. Nearly three-fourths4 of that return came from dividends, averaging a 4.3%2 yield per year. For companies that pay little to no dividends, the contribution from yield is smaller. These often young or fast-growing companies may instead use the cash they generate to pursue other goals, like paying down debt to improve their balance sheets, reinvesting in existing business lines, or acquiring other firms to spur growth. If successful, these improvements should promote the other drivers of returns and compensate for the lack of dividend.
As with earnings growth, investors should consider the sustainability of dividends. Companies that sport unusually high yields may not be investing enough capital back into the business, putting future dividends in jeopardy. Also, keep in mind share repurchases are another way companies may return capital to shareholders. While the return contribution from buybacks is not as obvious as that from dividend yields (buybacks are ultimately reflected in earnings growth), it can be a significant driver of returns.
As pundits on CNBC and Bloomberg remind us daily, countless factors roil stock returns in the short run, but for most investor’s longer-term returns are what counts. Keep in mind some of the drivers of those returns — earnings growth, multiple expansion, and dividend yields — and you can separate the signal from the noise.

Read the Financial Focus August 2020:
- "Expect the Best, But Plan for the Worst" By Cheryl Langston, CFP® »
- "International Equity — Are the Glaciers Melting?" By Dan Trosch, CFA® »
- "Master of My Domain" By Kristan L. Anderson, CEBS, CFP® »
Footnotes:
1 Company Fiscal Year
2 Calculated using FactSet’s Estimates Database
3 Total return calculated with Calendar Year Dates using FactSet’s Price Database
4 West Financial Analysis
Additional Resources:
Important Disclosures
West Financial Services, Inc. offers investment advisory services and is registered with the U.S. Securities and Exchange Commission (“SEC”). SEC registration does not constitute an endorsement of the firm by the SEC nor does it indicate that the firm has attained a particular level of skill or ability. You should carefully read and review all information provided by WFS, including Form ADV Part 1A, Part 2A brochure and all supplements, and Form CRS. The information contained herein does not constitute investment advice or a recommendation for you to purchase or sell any specific security. You are solely responsible for reviewing the content and for any actions you take or choose not to take based on your review of such content.
This information is intended to be educational in nature, and not as a recommendation of any particular strategy, approach, product or concept. Information on the stocks identified above is provided for illustrative purposes only and is not indicative of such securities’ or a client’s future performance. The provision of information regarding the stocks identified above should not be deemed as investment advice or a recommendation to purchase or sell any specific security. No representations or warranties whatsoever are made by WFS or any other person or entity as to the future performance or profitability of the identified security. All securities are subject to a risk of loss, including up to the amount invested. Past performance is not a guarantee of future results. WFS maintains a list of recommended securities for portfolio management purposes. A list of past recommendations and performance results of such recommendations is available upon request.
Certain information contained herein was derived from third party sources as indicated. While the information presented herein is believed to be reliable, no representation or warranty is made concerning the accuracy of any information presented. We have not and will not independently verify this information. Where such sources include opinions and projections, such opinions and projections should be ascribed only to the applicable third party source and not to West Financial Services, Inc.