


Time… Is On My Side… Yes It Is
The Rolling Stones originally released their single “Time Is On My Side” in the U.S. in September 1964. It became their first U.S. top ten hit, peaking at number 6 on the Billboard Hot 100 Chart in December 1964. The Rolling Stones would go on to deliver a total of 23 top ten hits and the band was inducted into the Rock & Roll Hall of Fame in 1989. Fun facts – the band released a second version in the U.K. in January 1965, which receives more airplay than the original today. Written by Jerry Ragovoy (under the pseudonym “Stones”) with the only words being “Time is on my side” and “You’ll come runnin’ back,” the song was actually released two times before The Rolling Stones versions. Kai Winding with vocals by Cissy Houston (yes, Whitney’s mother), Dionne Warwick, and Dee Dee Warwick originally released it in October 1963 and then Irma Thomas produced an R&B cover of the song in June 1964.
What does this have to do with investments or your money you may ask? Plenty.
The power of compounding returns on investments illustrates that, in fact, time is on our side. Compound returns on an investment refers to the benefit of reinvesting profits earned from an investment in one period to earn more profits in the future. This is a powerful tool for generating long-term wealth.
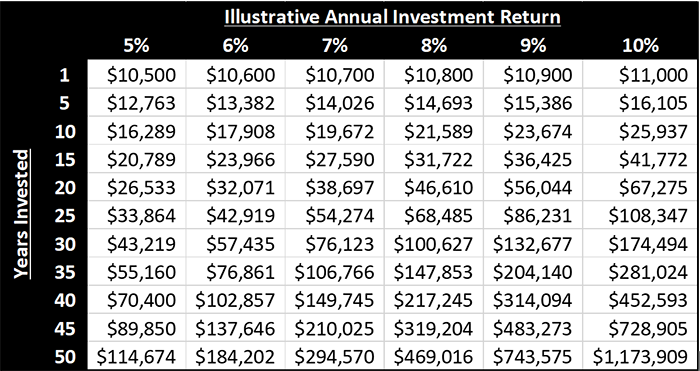
The concept of compound returns is simple, yet it can be difficult to grasp without a clear example. Suppose you invest $10,000 in a stock that grows at a rate of 10% per year. After the first year, your investment is worth $11,000. If you leave that money invested and it grows at the same rate for the second year, you would earn $1,100 in profits, bringing your total investment value to $12,100. If you continue this process for years, your investment can continue to grow, and the amount of money you earn each year can continue to increase.
The rate of return and the length of holding time affect compound returns on an investment. The chart below illustrates the impacts that both rate of return and holding time have on a hypothetical $10,000 initial investment. As you can see, expected values are higher for higher rates of return if you hold the length of the investment constant and expected values are higher for longer holding times if you hold the rate of return constant.
An important thing for investors to remember when considering compound returns on investments is that patience and a long-term perspective are usually rewarded. While it can be tempting to try to time the market or chase short-term gains, the real power of compound returns comes from holding investments for long periods of time and allowing the compounding effect to work its magic.
A final note, the estimable Albert Einstein understood the power of compounding and famously noted, “Compound interest is the eighth wonder of the world. He who understands it, earns it … he who doesn’t … pays it.” Perhaps Mick Jagger understands.
Feel free to share this story with your children, grandkids, friends, and neighbors. We’d be happy to help put time on your, and their side. The sooner we start, the better.
Meet R. Jonathan Stolz, CFA | Portfolio Manager »
West Financial Services, Inc. ("WFS") offers investment advisory services and is registered with the U.S. Securities and Exchange Commission ("SEC"). SEC registration does not constitute an endorsement of the firm by the SEC nor does it indicate that the firm has attained a particular level of skill or ability. You should carefully read and review all information provided by WFS, including Form ADV Part 1A, Part 2A brochure and all supplements, and Form CRS.
Certain information contained herein was derived from third party sources, as indicated, and has not been independently verified. While the information presented herein is believed to be reliable, no representation or warranty is made concerning the accuracy of any information presented. Where such sources include opinions and projections, such opinions and projections should be ascribed only to the applicable third party source and not to WFS.
This information is intended to be educational in nature, and not as a recommendation of any particular strategy, approach, product, security, or concept. These materials are not intended as any form of substitute for individualized investment advice. The discussion is general in nature, and therefore not intended to recommend or endorse any asset class, security, or technical aspect of any security for the purpose of allowing a reader to use the approach on their own. You should not treat these materials as advice in relation to legal, taxation, or investment matters. Before participating in any investment program or making any investment, clients as well as all other readers are encouraged to consult with their own professional advisers, including investment advisers and tax advisers.