Investing in Times of Volatility

Well… the stock market finally pulled back. After three years of fantastic performance, the market is down so far this year.
S&P 500 Total Return
04-30-22 -12.9%
12-31-21 28.7%
12-31-20 18.4%
12-31-19 31.5%
Source: Standard & Poor’s
In times of uncertainty and market volatility, some may be inclined to react and need guidance or reassurance based on their situation, history, and current economic data. When we are constantly bombarded with the negative news of the horrors in Ukraine, China, COVID, staffing shortages, etc., and we see and experience the outcomes all around us, it is challenging at times to not harness what we are biologically programmed to do: react to the situation!
The stock market does not go up in a straight line forever. What we are experiencing is a natural cycle in response to current events.
That said, let’s take a look at some positive data:
- From 2012 through 2021, the S&P 500 enjoyed an average annual return of 14.8%.
- From 1926 through 2021, the U.S. stock market has posted an average annual return of 10.5%.
Source: Standard & Poor’s
You can achieve respectable returns during periods where crises seemed to abound: The Great Depression, World War II, the Korean War, the Cuban Missile Crisis, Vietnam, the civil unrest of the 1960s, the Cold War, the OPEC Oil Embargo, the Financial Crisis in ‘09, COVID. Were there highs and lows in the market? Of course! And yet, our country and our economy remained resilient. And though not a betting man, I would bet we continue our ability to ride out the turbulence, gracefully. Alright, maybe the ride isn’t so graceful every time, but it comes to an end and we firmly plant our feet on the ground and move forward, often better off for the experience.
Stock Market Since 1900
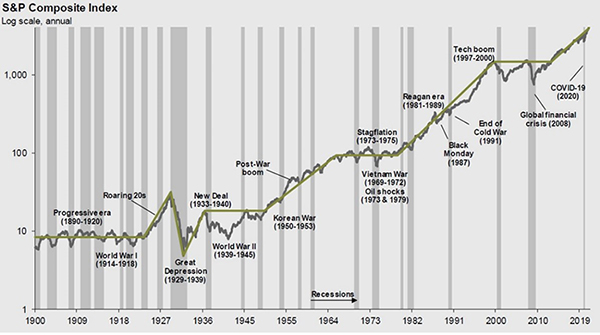
Source: FactSet, NBER, Robert Shiller, J.P. Morgan Asset Management
The United States remains the strongest country in the world, both economically and militarily, by a long shot. It will remain that way for the foreseeable future. No other country comes close — China included.1
Largest Economies by GDP in 2021
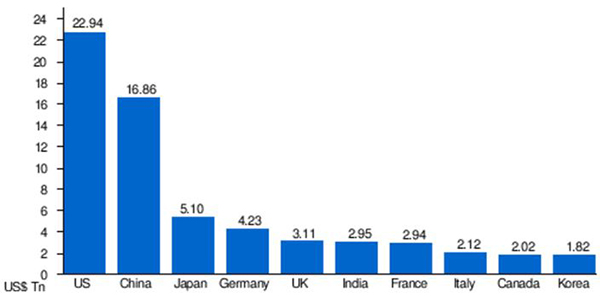
Source: International Monetary Fund
Legendary investor Warren Buffett has a famous saying: “I try to be fearful when others are greedy and greedy when others are fearful.”2 On the surface, it suggests that investors avoid herd mentality. The deeper meaning is that, when it comes to investing, it is always best to evaluate both the negative and positive influencing factors and focus on the facts. In other words, focus on your individual goals, timeline, and needs against this backdrop. And if you have questions about your investments, rely on us for prudent guidance and please give us a call.
Read the Financial Planning Focus May 2022:
- "Understanding Your Credit Score – Part I" by Matt Weinberg and Toni Majoy, Sandy Spring Bank »
- "To Roth or Not To Roth" by Victoria Henry, CFP® »
- "I Can’t Believe I’m Retiring" by Kimberly A. Cox, CFP® »
Sources:
1World Bank: Global Economic Prospects; January 2022.
2Warren Buffett: Letters to Shareholders; 1977-2022.
IMPORTANT DISCLOSURES
- West Financial Services, Inc. (“WFS”) offers investment advisory services and is registered with the U.S. Securities and Exchange Commission (“SEC”). SEC registration does not constitute an endorsement of the firm by the SEC nor does it indicate that the firm has attained a particular level of skill or ability. You should carefully read and review all information provided by WFS, including Form ADV Part 1A, Part 2A brochure and all supplements, and Form CRS.
- Certain information contained herein was derived from third party sources, as indicated, and has not been independently verified. While the information presented herein is believed to be reliable, no representation or warranty is made concerning the accuracy of any information presented. Where such sources include opinions and projections, such opinions and projections should be ascribed only to the applicable third party source and not to WFS.
- This information is intended to be educational in nature, and not as a recommendation of any particular strategy, approach, product or concept. These materials are not intended as any form of substitute for individualized investment advice.