Investment Management - Second Quarter 2023

Visibility Improving
Last year, as the Federal Reserve altered their path of tightening monetary conditions, we noted that overall visibility had become “muddled.” During the second quarter, improving economic data has provided investors with levels of visibility not experienced in some time. It wasn’t immediate since concerns over regional bank stability were still top of mind. By May, however, as employment and other data continued to show resilience of the U.S. economy, more economists embraced a soft-landing scenario – where the Federal Reserve successfully brought the rate of inflation lower with only limited damage to the economy.
Another factor that assisted the turn in sentiment was Artificial Intelligence, or “AI.” AI became the secular theme de jour. Investors see exploding demand for cutting edge microprocessors, along with rising capital expenditures that could support economic growth. While not a new idea, “AI“ and generative AI have sparked enthusiasm amongst investors, fanning animal spirits and even a little FOMO, or Fear of Missing Out, for companies in that space. There is additional buzz about government spending that is expected to be tailwinds for the economy, including rebuilding the nation’s infrastructure and green energy initiatives.
The chase for AI brought investors back to mega-cap technology companies that were shunned last year. The rebound in the so-called “magnificent seven” stocks contributed to the total return for the S&P 500 being up 8.74% for the quarter. Medium and small companies underperformed their large cap counterparts, with the S&P 400 and S&P 600, returning 4.85% and 3.38%, respectively. International equities also finished slightly higher, returning 2.95%.
Performancei for various indices for the three-month (not annualized), one-year, three-year, and five-year periods appears below:
Bond Indices
| Dates | ICE BofA 1-5 Yr. | ICE BofA 1-10 Yr. | ICE BofA 1-12 Yr. Muni |
|---|---|---|---|
|
3/31/23 - 6/30/23 |
0.12% | -0.08% | -0.51% |
|
6/30/22 - 6/30/23 |
1.70% | 1.79% | 2.13% |
|
6/30/20 - 6/30/23 |
-0.85% | -1.75% | -0.36% |
|
6/30/18 - 6/30/23 |
1.85% | 2.01% | 1.60% |
Equity Indices
| Dates | Dow Jones Ind. Avg. | NASDAQ Composite | S&P 500 (Large) | S&P 400 (Medium) | S&P 600 (Small) | MSCI EAFE (Int'l) |
|---|---|---|---|---|---|---|
|
3/31/23 - 6/30/23 |
3.97% | 13.05% | 8.74% | 4.85% | 3.38% | 2.95% |
|
6/30/22 - 6/30/23 |
14.23% | 26.14% | 19.59% | 17.61% | 9.75% | 18.77% |
|
6/30/20 - 6/30/23 |
12.30% | 11.94% | 14.60% | 15.44% | 15.19% | 8.93% |
|
6/30/18 - 6/30/23 |
9.59% | 13.93% | 12.31% | 7.79% | 5.22% | 4.39% |
One of the main story lines in the first half of the year was the concentration of performance from those few, mega-cap technology stocks. The list includes Apple, Microsoft, Alphabet, Amazon, Nvidia, Tesla, and Meta, most of whom have been investing in AI for years. Microsoft made major headlines earlier this year, when they announced the “third phase of our long-term partnership with OpenAI through a multiyear, multibillion dollar investment to accelerate AI breakthroughs to ensure these benefits are broadly shared with the world.”ii
Corporate earnings have also been much better than expected, as companies navigated higher input costs and supply chain constraints with only slight impact to margins. Significant layoffs from technology companies even caused market participants to revise earnings expectations higher, particularly for the second half of 2023. As equity prices have risen faster than revisions, valuation multiples have also expanded. Taking the price-to-forward earnings expectations of the S&P 500, entering the second quarter, the index traded for a price-to-forward earnings multiple of 18.2x, and ended the quarter at 19.13x, compared to the 25-year average of 16.8x. While the cohort of mega-cap technology names appear fully valued, we note that small caps within the S&P 600 index trade at a lower valuation, currently 14.1x forward P/E ratio.
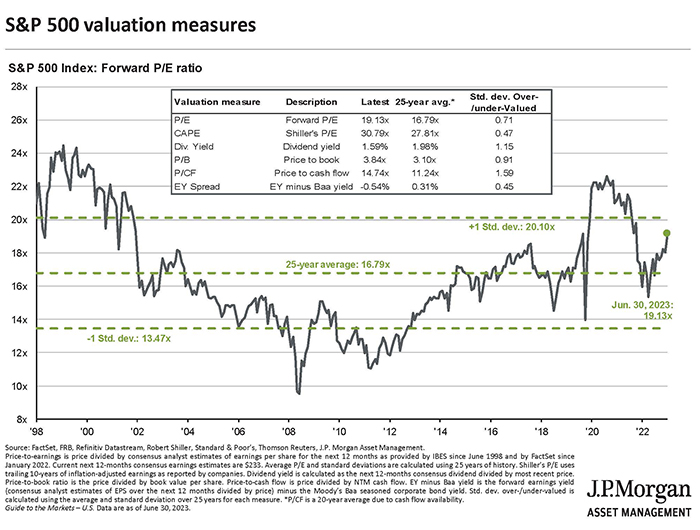
S&P 500 Valuation Measures Graph aboveiii
Since our last letter, visibility has also improved significantly regarding regional banks. After the collapse of Silicon Valley Bank and Signature Bank, quick action from the Treasury, Federal Reserve (the Fed), and Federal Deposit Insurance Corporation (FDIC) limited the regional banking crisis to a few institutions. Many regional banks still have balance sheet problems that will linger, though we believe the major problem has been contained. Despite tighter lending conditions, strong labor markets and consumer spending have led to a more resilient economic backdrop than most forecast.
The third and final estimate for first quarter U.S. Gross Domestic Product, or GDP, was 2% quarter-over-quarter growth compared to consensus expectations of 1.3%. Final demand, which strips out inventories, rose at a 4% rate while residential investment was much less of a headwind as it was the previous quarter. A strong labor market, along with job growth and rising wages, provides confidence for the average consumer to remain engaged. Retail spending has been positive, as well as strong durable goods data, driven by higher demand for automobiles.iv Positive surprises in housing data confirm the expansion continues, while businesses continue to invest in new technologies and their supply chains.
Latest readings on inflation data, using the Consumer Price Index (“CPI”), show inflation continuing to trend lower. Core CPI of 5.3% year-over-year was the lowest increase since November of 2021, while headline CPI fell under 5% for the first time in over two years.v The Fed’s preferred measure, Personal Consumption Expenditures Index, or PCE, has been stickier with May’s reading at 4.6%.vi The Fed raised the Fed Funds Rate by 25 basis points (to a target range of 5%-5.25%) in May,vii and futures market indicate one additional 25bps rate hike at the Fed’s July meeting.viii After deciding not to raise interest rates at their June meeting, the Fed appears ready to pause after the July meeting to watch as the past rate hikes filter through the economy.
Currently, a severe, hard landing scenario appears unlikely. Though it’s way too early to break out Johnny Nash records and sing “I Can See Clearly Now,” this song is always a reminder that things usually are never as bad as headlines indicate. Our opinion remains, that a recession is only being postponed, not cancelled. With the economic cycle mature, equity allocations will be kept closer to clients’ target, set in the Investment Policy Guidelines (IPG). While we agree with the enormous economic potential of AI, fundamental valuations of mega-cap technology stocks, as well as the S&P 500 index, are elevated relative to historical ranges. When appropriate, your portfolio manager may need to trim exposures to ensure that portfolios remain diversified. We will also continue to build international exposure to be more in-line with weightings in the WFS Benchmark.
In general, we are continuing to reinvest proceeds from stock sales into fixed income to take advantage of what we see as opportunities in the bond market. As we believe we are close to the end of this Fed rate hike cycle, we are able to invest in higher yields across all maturities. Since its peak of 4.33% in October of last year, the yield on a 10-year Treasury bond has traded within a range between 3.25% and 4%. These are broad comments about portfolio management, and investments for individual accounts are dependent on each client’s specific circumstances.
We shared an important message from Glen Buco earlier this month. Congratulations are in order to Brian Mackin as the next president of West Financial Services! Glen is taking some of his own advice and is shifting to a part-time schedule. Brian has been with West for over 22 years, serving in many roles, departments, and teams within the company. You can read Glen’s message on our website’s Special Release but know that West is still in good hands and Brian is committed to maintaining the highest quality of service to our clients.
In May, we welcomed Tara MK Barton and Anthony Esperanza to our client services team. Tara has over 25 years of comprehensive investment and financial operations experience. Prior to joining WFS, she worked for a local financial advisory firm. Tony earned his AA from Miami Dade College and is finishing his BS in Finance at the University of Maryland. Prior to joining WFS, Tony worked for a financial planning and investment advisory firm.
We have included our annual Privacy Notice to your report, as applicable, stating our policy on the confidentiality of client information. If you wish to opt out of sharing information, other than that which is required by law, please complete the form and mail it to West Financial or the Sandy Spring Bank address provided on the form. If you prefer, you may also opt-out by calling the number listed on the Privacy Notice. We have provided performance numbers for the quarter, one-year, three-year and five-year periods, where appropriate.
Follow us on LinkedIn or go to www.westfinancial.com to view our recent blog post. Thank you for your continued confidence in West Financial, and please do not hesitate to refer friends, family, or co-workers who you feel may benefit from our services.
 |
 |
|---|---|
| Brian L. Mackin, CFP® | Glenn Robinson, CFA |
|
President
|
Chief Investment Officer
|
iEach of the S&P 500 Index, the S&P 400 Index, the S&P 600 Index, the MSCI EAFE Index, the ICE BofA 1-5 Year Index, the ICE BofA 1-10 Year Index, the ICE BofA 1-12 Year Municipal Bond Index, the Dow Jones Industrial Average, and the NASDAQ Composite (each, an “Index”) is an unmanaged index of securities that is used as a general measure of market performance. The performance of an Index is not reflective of the performance of any specific investment. Each Index comparison is provided for informational purposes only and should not be used as the basis for making an investment decision. Further, the performance of your account and each Index may not be comparable. There may be significant differences between the characteristics of your account and each Index, including, but not limited to, risk profile, liquidity, volatility and asset comparison. The performance shown for each Index reflects no adjustment for client additions or withdrawals, and no deduction for fees or expenses. Accordingly, comparisons against the Index may be of limited use. Investments cannot be made directly into an Index.
iihttps://blogs.microsoft.com/blog/2023/01/23/microsoftandopenaiextendpartnership/
iiiJP Morgan Asset Management
ivhttps://www.census.gov/manufacturing/m3/adv/current/index.html
vhttps://www.bls.gov/news.release/archives/cpi_06132023.htm
vihttps://www.bea.gov/news/2023/personal-income-and-outlays-may-2023
viihttps://www.federalreserve.gov/newsevents/pressreleases/monetary20230503a.htm
viiihttps://www.cmegroup.com/markets/interest-rates/cme-fedwatch-tool.html?redirect=/trading/interest-rates/countdown-to-fomc.html
West Financial Services, Inc. (“WFS”) offers investment advisory services and is registered with the U.S. Securities and Exchange Commission (“SEC”). SEC registration does not constitute an endorsement of the firm by the SEC nor does it indicate that the firm has attained a particular level of skill or ability. You should carefully read and review all information provided by WFS, including Form ADV Part 1A, Part 2A brochure and all supplements, and Form CRS. The information contained herein does not constitute investment advice or a recommendation for you to purchase or sell any specific security. You are solely responsible for reviewing the content and for any actions you take or choose not to take based on your review of such content.
This information is intended to be educational in nature, and not as a recommendation of any particular strategy, approach, product or concept. These materials are not intended as any form of substitute for individualized investment advice. The discussion is general in nature, and therefore not intended to recommend or endorse any asset class, security, or technical aspect of any security for the purpose of allowing a reader to use the approach on their own. Certain information contained herein was derived from third party sources as indicated. While the information presented herein is believed to be reliable, no representation or warranty is made concerning the accuracy of any information presented. We have not and will not independently verify this information. Where such sources include opinions and projections, such opinions and projections should be ascribed only to the applicable third party source and not to WFS.
Certain statements herein reflect projections or opinions of future financial or economic performance. Such statements are “forward-looking statements” based on various assumptions, which may not prove to be correct. No representation or warranty can be given that the projections, opinions, or assumptions will prove to be accurate.