Investment Management - Third Quarter 2020
We provide a copy of our investment management letter, without enclosures, to keep you up-to-date on the investment markets and West Financial Services.i
The Comeback Kid Part II — The Road to Recovery
Movie sequels are notorious for being lackluster experiences, with profits prioritized over original ideas — Ghostbusters II comes to mind. Then there are movies that are equal to, or even better than the original, as fans of the Godfather series will attest. Movies and their sequels are meant to provide enjoyment and we believe this economic sequel will also give readers something to cheer about.
Despite the ongoing rise in the number of COVID-19 cases, equity markets continue to rally. Throughout the summer, consumer stocks benefited, as stimulus dollars and mortgage refinancing helped to strengthen consumer spending. Housing and automobile purchases are also rising, as people move away from urban centers. Technology stocks remain one of the biggest beneficiaries, due to the acceleration of secular trends in electronic payments and cloud infrastructure spending. Working, cooking, schooling, and staying home for months has sent sales of electronic goods through the roof.
Information technology is the largest sector in the S&P 500 and the out-performance of technology stocks partially explains how the index recovered so quickly. In early September, the index actually achieved a new all-time high, though equities did not finish the quarter in record territory. Reviewing third quarter performance, the total return for the large-cap S&P 500 was 8.93%. Mid and small capitalization indices rose 4.77% and 3.17%, respectively. International stocks, tracked by the MSCI EAFE, returned 4.80%.
Performance provided by Morningstar for various indices for the year-to-date (not annualized), one-year, three-year, and five-year periods appears below:
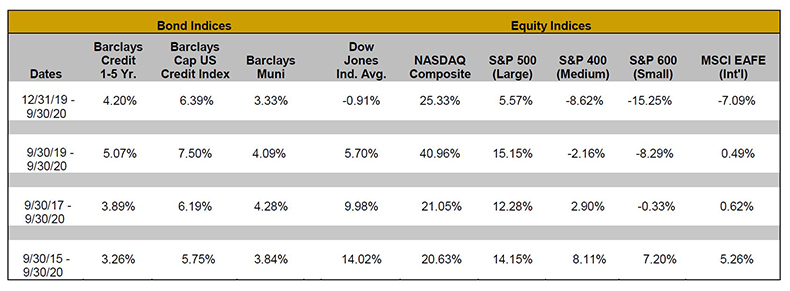
While the stock market has done well given the pandemic and economic backdrop, we need to be aware of the dichotomy between the stock market and another reality. This road to recovery has been very uneven. The hospitality and travel industry remains in poor shape, while many small businesses, which are not represented in the stock indices, are struggling. These areas are in need of additional and direct assistance. Deteriorating expectations for a fifth fiscal stimulus package from Washington, D.C. is likely one factor behind September’s pullback in stocks.
Gridlock in Washington is something we have come to expect. Unfortunately, it is occurring while we are experiencing a surge in new virus cases around the globe. The United Kingdom is warning citizens that if current trends are sustained, it could warrant a second economic shutdown. New York City is actively trying to impose restrictions in certain zip codes. This rise in cases and threat of renewed lockdowns continue to weigh on the service segment of the U.S. economy, which likely caused the number of new jobs to slow considerably last month with the U.S. Department of Labor reporting a total of 661,000, well below consensus expectations of 884,000.
According to McKinsey & Company, a management consulting firm, governments and central banks worldwide have unleashed $10 trillion in the first two months of the pandemic, which is more than three times the stimulus disbursed during the 2008 financial crisis.ii In an effort to ensure the sustainability of an economic recovery, the Federal Reserve has announced its plans to keep the fed funds rate at 0% until at least 2023. It is likely their desire for higher inflation is also factoring into the decision making process. After the most recent meeting, the Federal Open Market Committee (FOMC) stated a goal to allow inflation to go higher than 2% for a “moderate period of time.” Over the past ten years, inflation has averaged 1.8%, well below the target of 2%.
Meanwhile, the presidential election is approaching. First Trust Advisors L.P. data shows that, from 1926 through June 2018, there were nine bull markets and eight bear markets. The average bull market lasted 9.1 years while the average bear market lasted 1.4 years.iii As we have heard, elections do have consequences. However, it is important to note that most market events are not dictated by the President, but by larger geopolitical events.
As long-term investors, we remain focused on the big picture. While there may be subtle changes to portfolios, the thesis behind most of the investments is not related to the outcome of this election. We believe equity remains attractive relative to fixed income due to low interest rates, the potential for future capital appreciation, and dividends, and to use as a hedge against rising inflation. We also continue to make the case for bonds for the protection of principal.
Many of you cannot wait to turn the last calendar page on 2020, but there are still three months left to the year. It is likely to be anything but boring, so get your popcorn ready!
On October 22, 2020, West Financial Services will present the premier of our “Under the Hood” series. The first webinar will focus on our investment philosophy, as well as our process to create a customized portfolio. The presenters will be West Financial Services’ Chief Investment Officer, Glenn Robinson, CFA®, Director of Fixed Income, Norma Graves, CFP®, and Director of Portfolio Management, Kirstie Martinez.
We would like to introduce our newest employees, Anh Lam, IACCP®, CSCP® and Conor Datt. Anh joined West Financial in August as our chief compliance officer (CCO). She oversees the compliance program to ensure adherence to applicable laws and regulatory requirements. Anh also provides training and guidance to our staff on compliance-related matters. Transitioning the role to a full-time CCO demonstrates West Financial’s commitment to a culture of “doing the right thing” and protecting the interests of our clients. Anh previously ran the compliance program of another registered investment adviser in the Washington, D.C. metro area. Also in August, Conor Datt joined our client service department. Conor has a M.A. in Global Communications from The American University of Paris. He most recently worked at Thomson Reuters Tax & Accounting.
Kristan Anderson, Glen Buco, and Kim Cox were named to the Northern Virginia magazine’s Top Financial Professionals listing which was featured in the September 2020 issue.iv This is the tenth consecutive year we have been included in this list and we are honored to be recognized by our peers. In July 2020, the Financial Times recognized West Financial Services as one of the 300 Top Registered Investment Advisers in the U.S.v Also in July, West Financial Services was included in Financial Advisor magazine’s “2020 RIA Ranking by Total Assets.”vi
As we enter the final quarter of the year, please contact us should you have any questions or concerns regarding your year-end tax planning and/or gifting needs. We are compiling year-end capital gain estimates from the mutual funds we invest in on your behalf, and will be happy to provide this information to you and/or your accountant upon request. You should be receiving statements directly from your account custodian at least quarterly. If you are not receiving your statements, please contact us.
We have provided performance reports for the year-to-date, one-year, three-year, and five-year periods, where applicable. Should you have any questions regarding your portfolio, or any financial planning related questions, please call us at any time. Thank you for your continued confidence in us and please do not hesitate to refer friends, family or co-workers who you feel may benefit from our services.
|
President
|
Chief Investment Officer
|
Director of Fixed Income
|
|---|---|---|
 |
 |
 |
| Glen J. Buco, CFP® | Glenn Robinson, CFA | Norma Graves, CFP® |
iEach of the S&P 500 Index, the S&P 400 Index, the S&P 600 Index, the MSCI EAFE Index, the Barclays Credit 1-5 Year Index, the Barclays Cap U.S. Credit Index, the Barclays Capital Municipal Bond Index, the Dow Jones Industrial Average, and the NASDAQ Composite (each, an “Index”) is an unmanaged index of securities that is used as a general measure of market performance. The performance of an Index is not reflective of the performance of any specific investment. Each Index comparison is provided for informational purposes only and should not be used as the basis for making an investment decision. Further, the performance of your account and each Index may not be comparable. There may be significant differences between the characteristics of your account and each Index, including, but not limited to, risk profile, liquidity, volatility and asset comparison. The performance shown for each Index reflects no adjustment for client additions or withdrawals, and no deduction for fees or expenses. Accordingly, comparisons against the Index may be of limited use. Investments cannot be made directly into an Index.
iiCassim, Zayid, et al. “The $10 trillion rescue: How governments can deliver impact.” McKinsey and Company, June 5, 2020. https://www.mckinsey.com/industries/public-and-social-sector/our-insights/the-10-trillion-dollar-rescue-how-governments-can-deliver-impact#.
iii“History of U.S. Bear & Bull Markets Since 1926.” Cascade Financial Strategies, First Trust Portfolios L.P., https://www.cascadefs.com/wp-content/uploads/2019/01/Bull-and-Bear-Markets-9-28-18.pdf.
ivTo compile the Top Financial Professionals list, Northern Virginia Magazine enlisted input from the Certified Financial Planner Board of Standards, Inc. (the “CFP Board”) which grants and upholds the CFP® designation as a recognized standard of excellence in personal financial planning. Using data provided by the CFP Board, Northern Virginia Magazine asked CFP® certificants and other finance professionals in Northern Virginia to nominate peers. The “Top Financial Professional” listing is given to those financial advisors that receive the most nominations. Financial professionals do not pay a fee to be included.
vThe Financial Times Top 300 (“FT 300”) Registered Investment Advisors is an independent listing produced annually by Ignites Research, a division of Money-Media, Inc., on behalf of the Financial Times (July 2020). FT 300 assesses registered investment advisers (“RIAs”) on desirable traits for investors. To ensure a list of established companies with substantial expertise, they examine the database of RIAs registered with the US Securities and Exchange Commission and select those that reported to the SEC that they had $300 million or more in assets under management (“AUM”). The Financial Times invited qualifying RIA companies — more than 2,000 — to complete a lengthy application. Some 750 RIA companies applied and 300 made the final list. The formula the Financial Times uses to grade advisers is based on six broad factors and calculates a numeric score for each adviser. Areas of consideration include adviser AUM, asset growth, the company’s age, industry certifications of key employees, SEC compliance record and online accessibility. This award does not evaluate the quality of services provided to clients and is not indicative of the practice’s future performance. Neither the RIA firms nor their employees pay a fee to the Financial Times for inclusion in the FT 300.
viFinancial Advisor Magazine ranks advisers from across the nation by total assets under management, growth in assets, assets per client, growth in assets per client and the percentage change in number of clients based on a survey conducted by Financial Advisor Magazine of investment advisers registered with the SEC. Only RIAs participating in the survey are included in the rankings. Assets under management totals are taken from each firm’s Form ADV. Investor experience and returns were not considered as part of this ranking. RIAs do not pay a fee to be included in the Financial Advisor ranking.
West Financial Services, Inc. offers investment advisory services and is registered with the U.S. Securities and Exchange Commission (“SEC”). SEC registration does not constitute an endorsement of the firm by the SEC nor does it indicate that the firm has attained a particular level of skill or ability. You should carefully read and review all information provided by WFS, including Form ADV Part 1A, Part 2A brochure and all supplements, and Form CRS. The information contained herein does not constitute investment advice or a recommendation for you to purchase or sell any specific security. You are solely responsible for reviewing the content and for any actions you take or choose not to take based on your review of such content.
This information is intended to be educational in nature, and not as a recommendation of any particular strategy, approach, product or concept. These materials are not intended as any form of substitute for individualized investment advice. The discussion is general in nature, and therefore not intended to recommend or endorse any asset class, security, or technical aspect of any security for the purpose of allowing a reader to use the approach on their own. Certain information contained herein was derived from third party sources as indicated. While the information presented herein is believed to be reliable, no representation or warranty is made concerning the accuracy of any information presented. We have not and will not independently verify this information. Where such sources include opinions and projections, such opinions and projections should be ascribed only to the applicable third party source and not to West Financial Services, Inc.
Certain statements herein reflect projections or opinions of future financial or economic performance. Such statements are “forward-looking statements” based on various assumptions, which may not prove to be correct. No representation or warranty can be given that the projections, opinions, or assumptions will prove to be accurate.
|
|