Investment Management - Third Quarter 2023

Dog Days of Investing
Over the prior three months, rising temperatures and hot economic growth had equity investors searching for shade. In late July, second quarter GDP exceeded expectations, with an advance of 2.4%.i At the same time, initial estimates of “real-time” third quarter GDP, such as the Atlanta Fed’s GDPNow, indicated further acceleration was likely.ii While strong economic growth is normally welcomed, it complicates the Federal Reserve’s (the Fed’s) mission to tame inflation and complete this cycle of monetary tightening after an aggressive campaign of rate hikes and balance sheet reduction, also referred to as quantitative tightening.
In addition to renewed uncertainty over monetary policy, the rise in long-term interest rates also damaged sentiment. Yields on the 10-year Treasury rose from 3.81% to 4.57% during the quarter. While it may not appear substantial, 10-year Treasury yields have not been above 4.25% since before the Great Financial Crisis in 2007.
During the first half of 2023, equity markets rebounded as the rate of inflation decelerated. Momentum continued through July, peaking shortly after second quarter GDP was announced. The final two months of the quarter were more difficult for investors, as markets digested a higher interest rate environment. For the full quarter, the large capitalization S&P 500 declined 3.27%. Mid and small capitalization companies continued to underperform their larger brethren, ending the quarter lower by 4.20% and 4.93%, respectively. International stocks, tracked by the MSCI EAFE index, fell 4.11%.
Performanceiii for various indices for the year-to-date (not annualized), one-year, three-year, and five-year periods appears below:
Bond Indices
| Dates | ICE BofA 1-5 Yr. | ICE BofA 1-10 Yr. | ICE BofA 1-12 Yr. Muni |
|---|---|---|---|
|
12/31/22 - 9/30/23 |
2.26% | 1.68% | -0.70% |
|
9/30/22 - 9/30/23 |
4.24% | 4.43% | 2.33% |
|
9/30/20 - 9/30/23 |
-1.06% | -2.47% | -1.37% |
|
9/30/18 - 9/30/23 |
1.78% | 1.69% | 1.17% |
Equity Indices
| Dates | Dow Jones Ind. Avg. | NASDAQ Composite | S&P 500 (Large) | S&P 400 (Medium) | S&P 600 (Small) | MSCI EAFE (Int'l) |
|---|---|---|---|---|---|---|
|
12/31/22 - 9/30/23 |
2.73% | 27.11% | 13.07% | 4.27% | 0.81% | 7.08% |
|
9/30/22 - 9/30/23 |
19.18% | 26.11% | 21.62% | 15.51% | 10.08% | 25.65% |
|
9/30/20 - 9/30/23 |
8.62% | 6.60% | 10.15% | 12.05% | 12.10% | 5.75% |
|
9/30/18 - 9/30/23 |
7.14% | 11.41% | 9.92% | 6.06% | 3.21% | 3.24% |
It is not unusual to experience lower equity prices in August and September due to seasonality. During August, when many investment professionals are on vacation, trading volumes tend to decline and volatility tends to rise. This skittishness occurs ahead of September, which has the distinction of typically being the worst month for equity performance, averaging a decline of 1.2% from 1928-2003, according to Yardeni Research.iv
Current valuations for the S&P 500, on a price-to-earnings basis, are approximately 18x forward estimates. This is high relative to the 25-year average of 16.8%. Under the hood however, the higher valuations of mega-cap technology companies, which trade at a premium to the overall market, are the main driver of elevated valuations. Software and cloud services generally have higher operating margins and free cash flow, which is cash received from operations minus capital expenditures, or CapEx.
As a component of GDP, CapEx is officially reported as non-residential fixed investment. After a stagnant 2022, business investment was the largest contributor to economic growth in the second quarter. Many businesses are investing in new supply chains or automation to offset the rising cost of labor. Companies are always searching for new technologies, and the vast potential of generative AI has started an arms race for computational power. The government has played a role as well, with fiscal spending packages to stimulate domestic semiconductor manufacturing capacity and rebuild infrastructure.
Nominal and Real U.S. 10-year Treasury Yieldsv
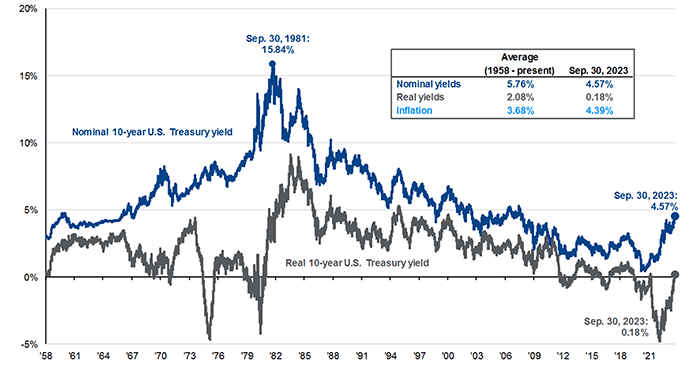
Source: BLS, FactSet, Federal Reserve, J.P. Morgan Asset Management.
This wave of business spending likely offset decelerated growth in personal consumption. Inflation has impacted consumers spending power and wage growth is slowing. Employment appears stable, with no sustained rise in jobless claims. While the current rate of inflation has declined dramatically from peak levels, it remains above the Fed’s target of 2%. At their September meeting, the committee maintained the Fed Funds Rate at its current level, and stated the committee will, “take into account the cumulative tightening of monetary policy, the lags with which monetary policy affects economic activity and inflation, and economic and financial developments.”vi
Investors are watching yields intently, since they not only influence equity valuations, but also because bonds become competition for equities if you can generate similar returns without the additional risk of stock market volatility. There is also growing concern regarding future demand for U.S. treasury debt at a time when issuance is increasing substantially. One traditional buyer of treasuries are sovereign nations, with Japan and China being the largest holders.vii Both countries have been reducing their positions, while ongoing balance sheet reduction by the Fed continues.
We would be remiss to not discuss the impact of recent geopolitical events. Financial markets are efficient at discounting these risks, though remain susceptible to drawdowns if signs of escalation develop. Since there are two armed conflicts occurring, small mistakes could lead to large problems that affect the entire globe. As always, these events are dynamic and we will monitor the situation as it evolves. If equity markets experience short-term panic selling due solely to headlines, we would view the impact as an opportunity for long-term investors.
With the new year approaching, in addition to the normal planning that occurs, it may be time to revisit your portfolio’s asset allocation. When interest rates were low, increased exposure to equities was warranted. Currently, fixed income yields are at levels not seen since 2007. If appropriate and if your personal circumstances have changed consider revisiting your target allocation decision with your West Financial team.
As we enter the final quarter of the year, please contact us should you have any questions or issues regarding your year-end tax planning and/or gifting needs. We are compiling year-end capital gain estimates from the mutual funds we invest in on your behalf and will be happy to provide this information to you and/or your accountant upon request. You should be receiving statements directly from your account custodian at least quarterly. If you do not receive your statements, please contact us.
In September, we welcomed Meena Radke to our client services team. Meena earned her BA from California State University Fullerton and her Certified Financial Planning Certificate from the University of California Irvine.
Also in September, West Financial hosted a webinar titled, “The Retirement Puzzle - How to Fit All the Pieces Together” featuring our very own relationship manager, Brian J. Horan, CPWA®. If you were unable to attend, there is a recording on the Events page on our website or we would be happy to provide the slides used in the webinar upon request.
Congratulations to Kristan Anderson, Glen Buco, and Victoria Henry for being named to the Northern Virginia Magazine’s Top Financial Professionalsviii listing featured in the September 2023 issue.
We have provided performance numbers for the year-to-date, one-year, three-year and five-year periods, where appropriate. Thank you for your continued confidence in West Financial, and please do not hesitate to refer friends, family, or co-workers who you feel may benefit from our services.
 |
 |
|---|---|
| Brian L. Mackin, CFP® | Glenn Robinson, CFA |
|
President
|
Chief Investment Officer
|
i https://www.bea.gov/sites/default/files/2023-09/gdp2q23_3rd.pdf
ii https://www.atlantafed.org/cqer/research/gdpnow.aspx
iii Each of the S&P 500 Index, the S&P 400 Index, the S&P 600 Index, the MSCI EAFE Index, the ICE BofA 1-5 Year Index, the ICE BofA 1-10 Year Index, the ICE BofA 1-12 Year Municipal Bond Index, the Dow Jones Industrial Average, and the NASDAQ Composite (each, an “Index”) is an unmanaged index of securities that is used as a general measure of market performance. The performance of an Index is not reflective of the performance of any specific investment. Each Index comparison is provided for informational purposes only and should not be used as the basis for making an investment decision. Further, the performance of your account and each Index may not be comparable. There may be significant differences between the characteristics of your account and each Index, including, but not limited to, risk profile, liquidity, volatility and asset comparison. The performance shown for each Index reflects no adjustment for client additions or withdrawals, and no deduction for fees or expenses. Accordingly, comparisons against the Index may be of limited use. Investments cannot be made directly into an Index.
iv https://www.yardeni.com/pub/stmktreturns.pdf
v https://am.jpmorgan.com/us/en/asset-management/adv/insights/market-insights/guide-to-the-markets/
vi https://www.federalreserve.gov/monetarypolicy/files/monetary20230920a1.pdf
vii https://ticdata.treasury.gov/Publish/mfh.txt
viii To compile the Top Financial Professionals listing, Northern Virginia Magazine enlisted input from the Certified Financial Planner Board of Standards, Inc. (the “CFP Board”) which grants and upholds the CFP® designation as a recognized standard of excellence in personal financial planning. Using data provided by the CFP Board, Northern Virginia Magazine asked CFP® certificants and other finance professionals in Northern Virginia to nominate peers. The “Top Financial Professional” listing is given to those financial advisors that receive the most nominations. Financial professionals do not pay a fee to be included.
West Financial Services, Inc. (“WFS”) offers investment advisory services and is registered with the U.S. Securities and Exchange Commission (“SEC”). SEC registration does not constitute an endorsement of the firm by the SEC nor does it indicate that the firm has attained a particular level of skill or ability. You should carefully read and review all information provided by WFS, including Form ADV Part 1A, Part 2A brochure and all supplements, and Form CRS. The information contained herein does not constitute investment advice or a recommendation for you to purchase or sell any specific security. You are solely responsible for reviewing the content and for any actions you take or choose not to take based on your review of such content.
This information is intended to be educational in nature, and not as a recommendation of any particular strategy, approach, product or concept. These materials are not intended as any form of substitute for individualized investment advice. The discussion is general in nature, and therefore not intended to recommend or endorse any asset class, security, or technical aspect of any security for the purpose of allowing a reader to use the approach on their own. Certain information contained herein was derived from third party sources as indicated. While the information presented herein is believed to be reliable, no representation or warranty is made concerning the accuracy of any information presented. We have not and will not independently verify this information. Where such sources include opinions and projections, such opinions and projections should be ascribed only to the applicable third party source and not to WFS.
Certain statements herein reflect projections or opinions of future financial or economic performance. Such statements are “forward-looking statements” based on various assumptions, which may not prove to be correct. No representation or warranty can be given that the projections, opinions, or assumptions will prove to be accurate.