Investing at All-Time Highs

It can be nerve-racking investing at all-time highs in the stock market. Should it be? The data says no.
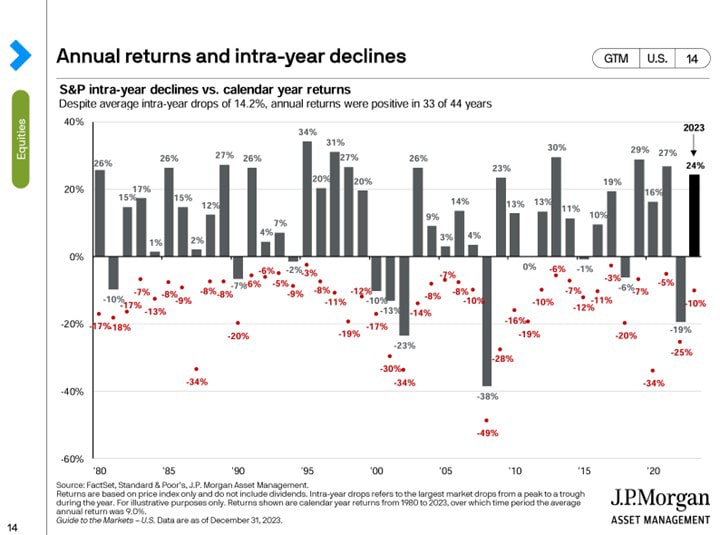
The past is not predictive of the future, but it helps paint a picture of potential outcomes. Let’s dive in by studying annual stock market (S&P 500) return data from NYU (source). Since 1928, the stock market has had positive years around 73% of the time, with an average annual gain of 11.7%. The average masks the large variance in outcomes, with the lowest return of -43.8% coming in 1931 (Great Depression) and the highest return of 52.5% coming in 1954 (post-recession). The annual return also masks the intra-year volatility of equities. The good news for savers is, historically stocks have gone up over the long run (see my prior article explaining why).
So, what happens when we end the year at a new high? The data tells us that the following year is positive 71.7% of the time boasting an average return of 10.2%. That said, the range of outcomes following new all-time highs contains a low of -36.6% (Great Recession) and a high of 37.2% in 1995 (start of the dot.com bubble). In this scenario, the average return is a bit lower, and the range of outcomes is tighter. For more detail, return distribution below counts the percent of years that the market return lies in the various return ranges. This was run for all the years (1928-2023) as well for only new annual all-time highs.
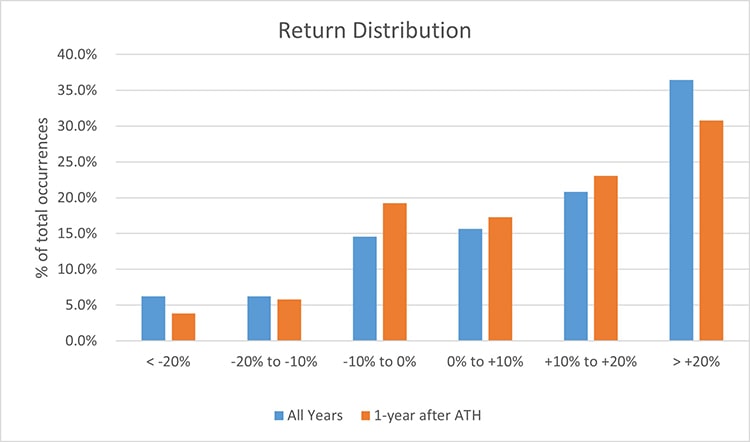
Source: NYU Data, WFS Analysis
I know what you are thinking, the market just went up 26% in 2023, surely the party stops here? You are probably getting sick of this, but once again let’s go back to our data. In years where the stock market gains more than 25%, the following year is positive 64% of the time, generating an average return of 8.7%. Comparatively, a bit lower than the long-term average, but still solid. In fact, the market has historically ended the year at a new all-time high ~57% of the time and you are more likely to gain 25% (35 times) than the market be negative (26 times).
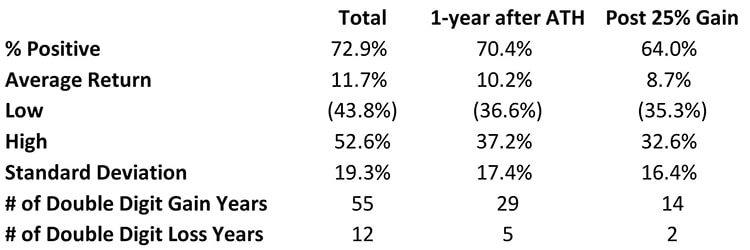
Source: NYU Data, WFS Analysis
For those that like a more granular analysis utilizing daily all-time highs, this piece from RBC is good. The takeaways are the same. Stocks tend to rise over time and the longer the time horizon, the higher chance of success. New all-time highs are normal and should not be feared! We don’t know what the future will hold, but as the adage says, it's not about timing the market, but about time in the market.
Additional Reading & Great Blogs to Follow:
- https://ofdollarsanddata.com/should-you-invest-in-stocks-at-all-time-highs/
- https://awealthofcommonsense.com/2024/01/what-comes-after-a-good-year-in-the-stock-market/
Read the February 2024 Financial Planning Focus:
- "Where Do Our Healthcare Dollars Go?" By Glenn Guard, CFA »
- "To Rent or to Buy?" By Victoria Henry, CFP® »
- "Take Advantage of New IRS Rules" by Laurie Kramer, CFP® »
IMPORTANT DISCLOSURES
West Financial Services, Inc. (“WFS”) offers investment advisory services and is registered with the U.S. Securities and Exchange Commission (“SEC”). SEC registration does not constitute an endorsement of the firm by the SEC nor does it indicate that the firm has attained a particular level of skill or ability. You should carefully read and review all information provided by WFS, including Form ADV Part 1A, Part 2A brochure and all supplements, and Form CRS.
Certain information contained herein was derived from third party sources, as indicated, and has not been independently verified. While the information presented herein is believed to be reliable, no representation or warranty is made concerning the accuracy of any information presented. Where such sources include opinions and projections, such opinions and projections should be ascribed only to the applicable third party source and not to WFS
This information is intended to be educational in nature, and not as a recommendation of any particular strategy, approach, product, security, or concept. These materials are not intended as any form of substitute for individualized investment advice. The discussion is general in nature, and therefore not intended to recommend or endorse any asset class, security, or technical aspect of any security for the purpose of allowing a reader to use the approach on their own. You should not treat these materials as advice in relation to legal, taxation, or investment matters. Before participating in any investment program or making any investment, clients as well as all other readers are encouraged to consult with their own professional advisers, including investment advisers and tax advisers.
Certain statements herein reflect projections or opinions of future financial or economic performance. Such statements are “forward-looking statements” based on various assumptions, which may not prove to be correct. No representation or warranty can be given that the projections, opinions, or assumptions will prove to be accurate.