Investment Management - Fourth Quarter 2022

Everything Everywhere All at Once
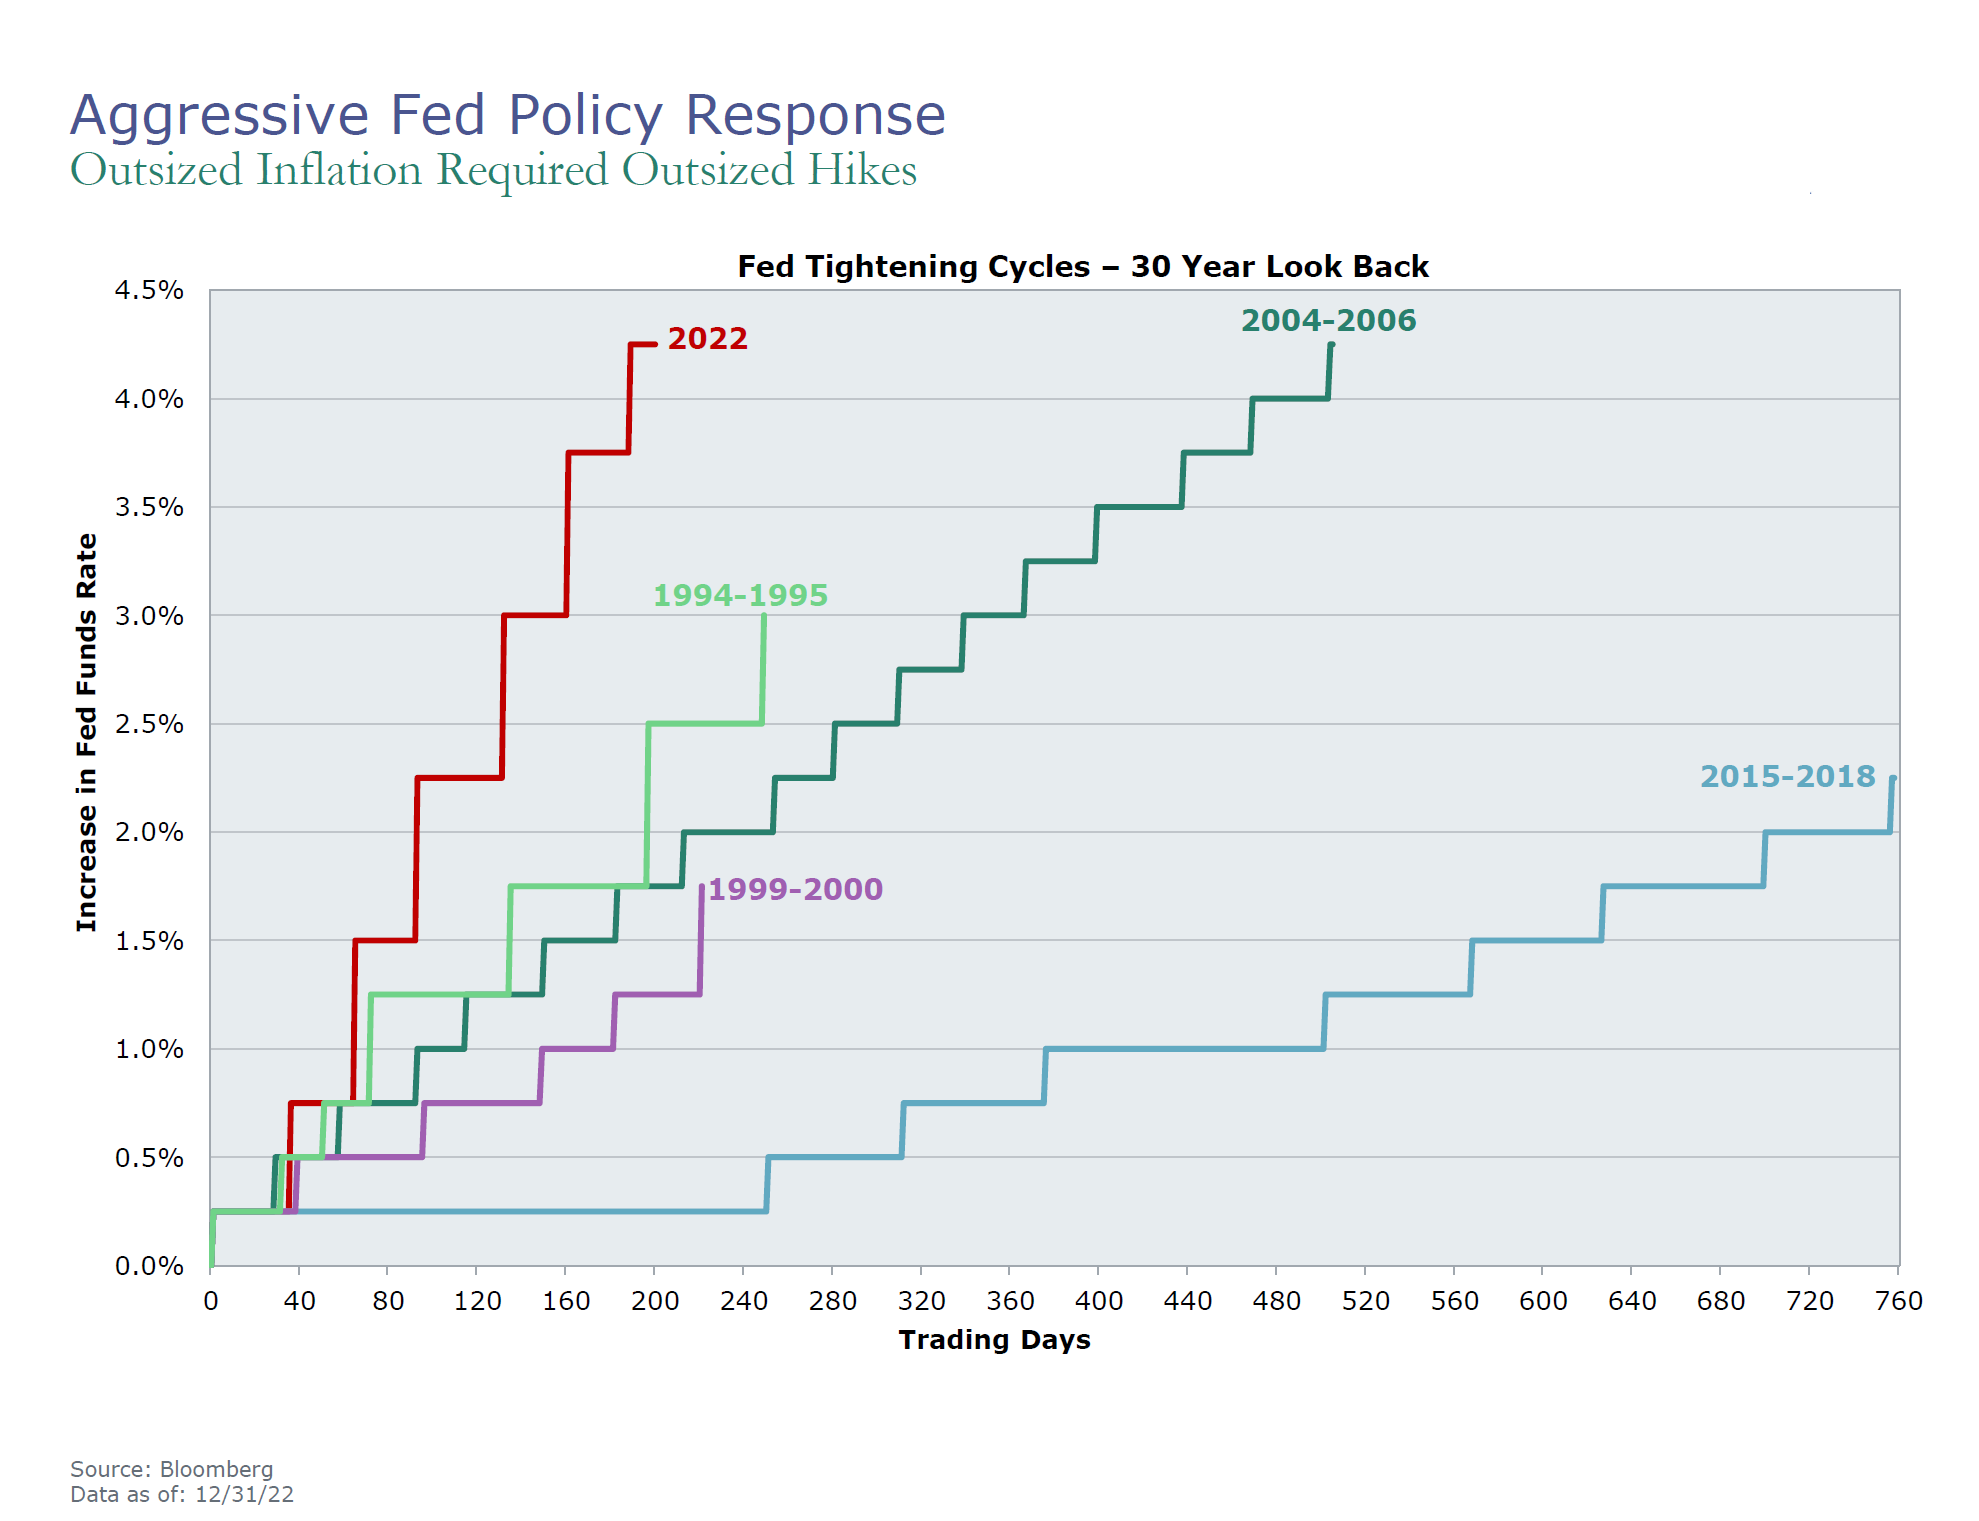
For investors, 2022 was all about rising interest rates and the impact on financial markets. In late 2021, the Federal Reserve ("the Fed") was still purchasing treasuries and mortgage-backed securities, which was part of their policy response during the pandemic. The Fed was also behind the curve in understanding how sticky inflation would prove to be. In December of 2021, their dot-plot of rate projections forecasted that the Fed would raise the fed funds rate by only 75 basis points in 2022.i
Fast forward to early 2022 and concerns over elevated inflation forced the Federal Reserve to pivot, tightening monetary policy, dramatically. What occurred was the most aggressive tightening cycle in modern history. As investors digested the new reality, volatility for stocks and bonds spiked, resulting in one of the worst years on record for fixed income performance.
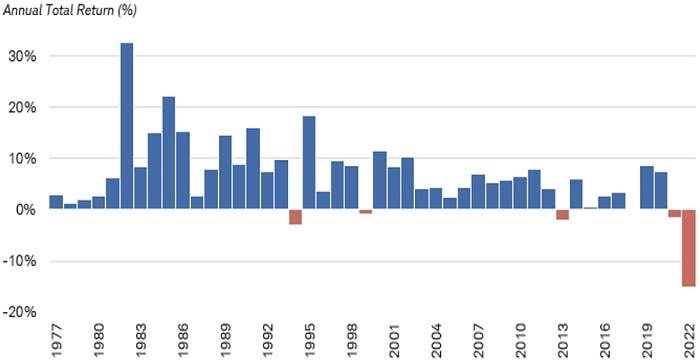
Source: Schwab Center for Financial Research with data provide by Morningstar, Inc.
Rising uncertainty also negatively impacted equity markets early in the year. While the S&P 500 fell 18.11% in 2022, much of the decline occurred in the first half of the year, with equity performance ending with positive momentum. During the fourth quarter, the total return for the S&P 500 was 7.56%. Mid and small capitalization stocks, tracked by the S&P 400 and S&P 600, rose 10.78% and 9.19%, respectively. The international MSCI EAFE Index jumped 17.34%, mainly due to a weaker U.S. dollar.
Performanceiii for various indices for the three-month (not annualized), one-year, three-year, and five-year periods appears below:
Bond Indices
| Dates | ICE BofA 1-5 Yr. | ICE BofA 1-10 Yr. | ICE BofA 1-12 Yr. Muni |
|---|---|---|---|
|
9/30/22 - 12/31/22 |
1.93% | 2.70% | 3.06% |
|
12/31/21 - 12/31/22 |
-6.10% | -9.63% | -4.90% |
|
12/31/19 - 12/31/22 |
-0.36% | -1.19% | -0.17% |
|
12/31/17 - 12/31/22 |
1.37% | 1.20% | 1.33% |
Equity Indices
| Dates | Dow Jones Ind. Avg. | NASDAQ Composite | S&P 500 (Large) | S&P 400 (Medium) | S&P 600 (Small) | MSCI EAFE (Int'l) |
|---|---|---|---|---|---|---|
|
9/30/22 - 12/31/22 |
16.01% | -0.79% | 7.56% | 10.78% | 9.19% | 17.34% |
|
12/31/21 - 12/31/22 |
-6.86% | -32.54% | -18.11% | -13.06% | -16.10% | -14.45% |
|
12/31/19 - 12/31/22 |
7.32% | 6.10% | 7.66% | 7.23% | 5.80% | 0.87% |
|
12/31/17 - 12/31/22 |
8.38% | 9.67% | 9.42% | 6.71% | 5.88% | 1.54% |
Defensive areas of the stock market, Utilities, Pharmaceuticals, and Consumer Staples, once again earned their reputation for protecting investors during corrections. However, it was the dramatic rise of energy stocks that stood apart. The invasion of Ukraine, along with associated sanctions, drove oil prices briefly over $130 per barrel, though the commodity finished the year at $80.51, up only 4.2% for the year. Leading the market lower were growth stocks, many of which were previous beneficiaries of consumers being told to stay home during the pandemic. This cohort was concentrated in information technology, communication services, and consumer discretionary sectors. Extremely low interest rates also factored into the decision for investors to buy growth, causing valuation multiples to expand. Despite the reset of valuations last year, many companies, such as Apple, are trading at prices well above pre-pandemic levels.
Another storyline from last year was elevated inflation, which hit levels that have not been experienced in decades. Recent data provides strong evidence that we are well past the peak in most categories, and inflation should decelerate materially throughout the year. Within the Core CPI measure, shelter is the last major component still showing strong month-over-month readings. Despite this strength, weaker home prices and "real-time" information on apartment rents, confirm the lagging effect in this category.iv
The Fed remains concerned about elevated wage gains sustaining demand, though similar to other indicators, year-over-year increases in wage gains have also begun to decelerate. Fed officials have repeatedly referenced what occurred in the 1970s, when the central bank was able to lower the inflation rate twice, only to see it quickly return. While there are substantial differences between that environment and today, the Fed continues to deliver guidance of higher interest rates, with no rate cuts until 2024.
Tighter monetary policy weighs on the potential for economic growth. The continued deceleration of several indicators, specifically the Institute of Supply Management's report on manufacturing, Conference Board's index of Leading Economic Indicators, along with inversion of the 2-year & 10-year Treasury spreads, have signaled that the probability of a recession is high.
Offsetting those factors is strength of employment, domestically. Usually deemed a lagging indicator, since shifts in employment hiring trends trail cyclical data points in manufacturing. Currently, the tight labor market is causing companies to hoard workers over fear that they will not be able to fill positions when the economy begins to improve. So, despite the job reductions at many publicly-traded technology companies, small and medium size businesses are still hiring. Internationally, expectations for China's economy are rising, after the country reversed its zero-tolerance COVID policy. This potentially helps emerging market economies, particularly in South East Asia and countries that rely on commodity exports.
In our Investment Committee meetings, we dedicate substantial time assessing what lies ahead. A combination of economic data, corporate filings, and third-party research provide valuable insight. Unfortunately, the outlook remains muddled. The probability that the Fed can deliver a so-called "soft-landing" has fallen. This would be the goldilocks scenario, where economic activity slows by curtailing aggregate demand, while keeping employment relatively stable.
There are three significant items we are monitoring. First, changes in the current state of the labor market, specifically watching for an acceleration of layoff announcements nationwide. Second, the negative revisions that are occurring in forecasts of corporate earnings. During a recession, current estimates could prove to be too optimistic, resulting in renewed weakness for stocks. Third, the difference in outlook for the future path of short-term interest rates between the Fed and financial markets. Fed Funds Futures indicate that financial markets expect lower interest rates, as soon as July, which is six months earlier than the Fed's guidance.
Last year was one of the most difficult environments on record for most money managers, particularly firms like ours who allocate across asset classes. According to some estimates, due to the decline in both stocks and bonds, performance of a standard 60/40 portfolio (60% allocated to equities and 40% to bonds and cash) was the worst in 90 years. Despite the weakness in bond prices, fixed income allocations should continue providing ballast to equities in allocated portfolios.
Over the last two years, we have reduced equity allocations, particularly large-cap and "growth" securities that have appreciated materially during the last cycle. Going forward, we believe a more balanced approach to equity investing will be key. We will move exposure to be more in line with weightings in the WFS Benchmark. Where appropriate, and based on client circumstances, this will moderately increase exposure to international equities, which trade at lower price-to-earnings multiples than U.S. stocks. This is a shift in strategy, as we have been underweight in our exposure to international equities since 2012.
Proceeds from stock sales are being reinvested, mainly into fixed income. With the individual bond ladder, we are locking in higher interest rates while slightly extending durations. We believe this adjustment will position portfolios well should rates fall. These are broad comments and are dependent on each client's specific circumstances.
Congratulations to Matt Cohen, Brian Horan, Abigail Just, Brian Mackin, Kirstie Martinez, and R. Jonathan Stolz for their recognition as Five Star Professional Five Star Wealth Managersv by Five Star Professional in November 2022.
We would also like to welcome our two newest employees hired in January. Angel Irazola joined our financial planning department as a senior financial planner. Angel earned his bachelor's degree in Political Science from the University of Michigan in Ann Arbor and holds an MBA from Georgetown University's McDonough School of Business. Maya Gentry, previously a senior universal banker at Sandy Spring Bank, joined West Financial as a client service associate. Maya graduated from George Mason University in 2017 with a bachelor's of science degree in Tourism, Hospitality, and Event Management.
We have provided performance numbers for the quarter, one-year, three-year and five-year periods, where appropriate. The custodian where your account is held will be sending Form 1099-DIV (dividends) and 1099-INT (interest) information to you directly. Also, the Form 1099-B will provide a record of realized gains and/or losses in taxable account(s) as well as any management fees paid directly from your brokerage account(s).
Any restrictions that you have placed on your account will be included with your statements. Please review these and contact us should there be any changes. Also, now would be a good time to review your asset allocation and risk tolerance. If you have had any changes to your income, marital status, state of residence, tax bracket, etc., please be sure to let us know.
Referrals of family, friends and colleagues who may benefit from financial planning and investment management guidance are always welcome. Thank you for recommending our firm and your continued trust in our financial planning and investment management services.
|
President
|
Chief Investment Officer
|
|---|---|
 |
 |
| Glen J. Buco, CFP® | Glenn Robinson, CFA |
iihttps://www.schwab.com/learn/story/fixed-income-outlook - Shown in the chart are annual total returns including price change and income for the Bloomberg US Aggregate Bond Index. Returns include reinvestment of interest. Indices are unmanaged, do not incur fees or expenses, and cannot be invested indirectly. For additional information, please see Schwab.com/Index Definitions. Past performance is no guarantee of future results. Diversification strategies do not ensure a profit and do not protect against losses in declining markets. For illustrative purposes only *YTD as of 9/27/2022.
iiiEach of the S&P 500 Index, the S&P 400 Index, the S&P 600 Index, the MSCI EAFE Index, the ICE BofA 1-5 Year Index, the ICE BofA 1-10 Year Index, the ICE BofA 1-12 Year Municipal Bond Index, the Dow Jones Industrial Average, and the NASDAQ Composite (each, an "Index") is an unmanaged index of securities that is used as a general measure of market performance. The performance of an Index is not reflective of the performance of any specific investment. Each Index comparison is provided for informational purposes only and should not be used as the basis for making an investment decision. Further, the performance of your account and each Index may not be comparable. There may be significant differences between the characteristics of your account and each Index, including, but not limited to, risk profile, liquidity, volatility and asset comparison. The performance shown for each Index reflects no adjustment for client additions or withdrawals, and no deduction for fees or expenses. Accordingly, comparisons against the Index may be of limited use. Investments cannot be made directly into an Index.
ivhttps://www.bls.gov/news.release/cpi.nr0.htm
vFive Star Wealth Manager Award program, managed by fivcestarprofssional.com, conducts market-specific research throughout the U.S. and Canada to select reputable, specialized, and honest service professionals. Award candidates that satisfied 10 objective criteria were named 2022 Five Star Wealth Managers. Required Eligibility Criteria: 1. Credentialed as a registered investment adviser (RIA) or a registered investment adviser representative; 2. Actively licensed as a RIA or as a principal of a registered investment adviser firm for a minimum of five years; 3. Favorable regulatory and complaint history review; 4. Fulfilled their firm review based on internal standards; and 5. Accepting new clients. Additional Evaluation Criteria: 1. One-year client retention rate; 2. Five-year client retention rate; 3. Non-institutional discretionary and/or non-discretionary client assets administered; 4. Number of client households served; and 5. Education and professional designations. FSP does not evaluate quality of services provided to clients. The award is not indicative of the wealth manager's future performance. Neither WFS nor any of its employees paid fivestarprofessional.com to be considered for this award.
West Financial Services, Inc. ("WFS") offers investment advisory services and is registered with the U.S. Securities and Exchange Commission ("SEC"). SEC registration does not constitute an endorsement of the firm by the SEC nor does it indicate that the firm has attained a particular level of skill or ability. You should carefully read and review all information provided by WFS, including Form ADV Part 1A, Part 2A brochure and all supplements, and Form CRS. The information contained herein does not constitute investment advice or a recommendation for you to purchase or sell any specific security. You are solely responsible for reviewing the content and for any actions you take or choose not to take based on your review of such content.
This information is intended to be educational in nature, and not as a recommendation of any particular strategy, approach, product or concept. These materials are not intended as any form of substitute for individualized investment advice. The discussion is general in nature, and therefore not intended to recommend or endorse any asset class, security, or technical aspect of any security for the purpose of allowing a reader to use the approach on their own. Certain information contained herein was derived from third party sources as indicated. While the information presented herein is believed to be reliable, no representation or warranty is made concerning the accuracy of any information presented. WFS has not and will not independently verify this information. Where such sources include opinions and projections, such opinions and projections should be ascribed only to the applicable third party source and not to WFS.
Certain statements herein reflect projections or opinions of future financial or economic performance. Such statements are "forward-looking statements" based on various assumptions, which may not prove to be correct. No representation or warranty can be given that the projections, opinions, or assumptions will prove to be accurate.