Investment Management - Fourth Quarter 2023

Are You Not Entertained?
During the last two years, financial markets have taken investors on a wild ride. In 2022, central banks were heavily criticized for being late to act as inflation rates soared to levels not experienced in 40 years. This called for a coordinated message across countries and aggressive action. The Federal Reserve (the Fed) tightened monetary policy by raising short-term interest rates at a historic pace, in addition to reversing the policy of quantitative easing. As the year progressed, declining asset prices turned concern to panic. Higher interest rates across the maturity spectrum had broad implications, since even high-quality bonds were re-priced. Treasury yields directly impact borrowing costs, which typically curtails demand for longer-term assets. As uncertainty rose, economists were quick to extrapolate weakness to other areas of the economy.
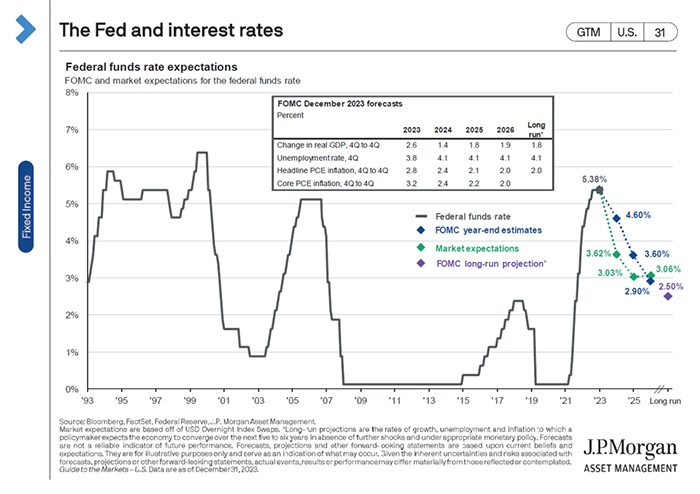
Entering 2023, the decline of broadly watched indicators such as the Conference Board’s Index of Leading Economic Indicators also weighed on consensus expectations for the economy and corporate earnings. Tighter monetary policy caused the rate of inflation to peak and consequently decelerate materially. While notes from the Federal Reserve’s December meeting acknowledges they remain “attentive to inflation risks,” their “Summary of Economic Projections” delivered a more supportive message to equity markets, and the crowd cheered.i
The pivot signals the Fed’s intention to loosen financial conditions, a welcome change, though it only had limited impact at the end of a sizzling rebound in stock prices. Over the last twelve months, large capitalization stocks continued to outperform as the S&P 500 soared 26.29%. Mid and small capitalization indices, tracked by the S&P 400 and S&P 600, rose 16.44% and 16.05%, respectively. International stocks, tracked by the MSCI EAFE Index, rose 18.24%.
Performanceii for various indices for the three-month (not annualized), one-year, three-year, and five-year periods appears below:
Bond Indices
| Dates | ICE BofA 1-5 Yr. | ICE BofA 1-10 Yr. | ICE BofA 1-12 Yr. Muni |
|---|---|---|---|
|
9/30/23 - 12/31/23 |
3.96% | 5.56% | 5.21% |
|
12/31/22 - 12/31/23 |
6.31% | 7.34% | 4.47% |
|
12/31/20 - 12/31/23 |
-0.18% | -1.29% | -0.02% |
|
12/31/18 - 12/31/23 |
2.41% | 2.67% | 1.89% |
Equity Indices
| Dates | Dow Jones Ind. Avg. | NASDAQ Composite | S&P 500 (Large) | S&P 400 (Medium) | S&P 600 (Small) | MSCI EAFE (Int'l) |
|---|---|---|---|---|---|---|
|
9/30/23 - 12/31/23 |
13.09% | 13.79% | 11.69% | 11.67% | 15.12% | 10.42% |
|
12/31/22 - 12/31/23 |
16.18% | 44.64% | 26.29% | 16.44% | 16.05% | 18.24% |
|
12/31/20 - 12/31/23 |
9.38% | 6.04% | 10.00% | 8.09% | 7.28% | 4.02% |
|
12/31/18 - 12/31/23 |
12.47% | 18.75% | 15.69% | 12.62% | 11.03% | 8.16% |
We believe there were two major factors behind the rally. Early last year, several large technology companies announced significant reductions of employees after years of excessive hiring. From an index level, these actions improved the outlook of the earnings-per-share for the S&P 500. Of greater importance was the economic impact of non-residential fixed investment discussed last quarter. Businesses have increased capital investment for several reasons, many of which are associated with important thematic trends, such as generative AI, supply chain realignment, electrification, or healthcare innovation. U.S. government spending is also contributing to growth after Congress approved approximately $4.5 trillion in aid to support investment in infrastructure, green energy, and domestic semiconductor manufacturing.
These trends should continue to support economic growth in the U.S. for several years, offsetting expectations for tepid increases of personal spending. Surprisingly, the labor market has only moderately weakened and unemployment remains low. Continuing claims for unemployment rose briefly, though not on a sustainable basis. The additional slack has slowed job gains, while potentially limiting wage gains. Recent data on retail sales and credit card spending confirm that, broadly, consumers remain engaged.
Presently, we believe other signals confirm the environment is steady, moderating from the third quarter’s torrid pace. Inflation data is cooperating, as the year-over- year growth rate trends lower towards the Fed’s target of 2%, based on Personal Consumption Expenditures (PCE).iii Based on recent levels of 10-year Treasury yields, fixed income investors appear to agree. Yields of the benchmark declined from a high of 5% in October, ending the year at 3.9%. Credit spreads, or the premium demanded for additional risk over a treasury bond with similar maturity, remain tight.
Looking ahead, investor sentiment is elevated as consensus agrees with a “soft-landing” for the U.S. economy. This optimistic view is slightly dependent on the Fed loosening policy in the near future. By cutting short-term interest rates, stocks of rate-sensitive and cyclical industries would likely outperform. This view does conflict with current guidance from the Fed, that the fed funds rate will be maintained “higher for longer.” Guidance can change as quickly as the facts do.
Currently, there are several indications of late-cycle behavior, including, but not limited to, deterioration within the employment data and the expanding use of credit to continue consumption. Delinquencies are rising, though debt service ratios are not alarming. Beginning in 2025, rising defaults of commercial real estate, or high yield debt, could disrupt growth.
As always, our Investment Committee analyzes and discusses headlines as they occur. Though the macro environment is dynamic and ever changing, it is important to consider longer-term context for our investments. Since a recession is not imminent, equity allocations are higher than target. The fourth year of a presidential cycle is usually positive for stocks, though geopolitical tensions could cause equities to diverge from their fundamentals, in the short-term. Broadly speaking, fixed income holdings also rebounded in price during 2023. We are increasing purchases of municipal bonds, where appropriate, due to current relative valuations. The potential for these positions improves should federal tax rates increase, which appears likely when the provisions of the 2017 Tax Cuts and Jobs Act sunset at the end of 2025.
-------------------------------------------------------------------------------------------
In November 2023, Brian Mackin, Kirstie Martinez, Matt Cohen, Brian Horan, Abigail Just, Jonathan Stolz, Dan Trosch, and Tanya Carson were recognized as Five Star Wealth Managers by Five Star Professional.iv
Congratulations to Glen Buco and Victoria Grossmann Henry for being recognized as Top Fee-Only Financial Planners* by Washingtonian magazine in January 2024.v
We have provided performance numbers for the quarter, one-year, three-year and five-year periods, where appropriate. The custodian where your account is held will be sending Form 1099-DIV (dividends) and Form 1099-INT (interest) information to you directly. Also, the Form 1099-B will provide a record of realized gains and/or losses in taxable account(s) as well as any management fees paid directly from your brokerage account(s). Please contact us if you have questions or need additional information for the preparation of your tax returns.
In addition to your statements, your packet will include any restrictions that you have placed on your account. Please review these and contact us should there be any changes. Also, now would be a good time to review your asset allocation and risk tolerance. If you have had any changes to your income, marital status, state of residence, tax bracket, etc., please be sure to let us know.
In closing, we would like to express our most sincere gratitude for your continued trust in our efforts. As we navigate the ever-changing economic and financial landscape, our commitment to your financial success is our top priority. We look forward to the opportunities ahead, and to helping you achieve your short- and long-term goals. If there is anything you would like to discuss in more detail, please do not hesitate to contact a member of your West team.
 |
 |
|---|---|
| Brian L. Mackin, CFP® | Glenn Robinson, CFA |
|
President
|
Chief Investment Officer
|
Sources:
i https://www.federalreserve.gov/newsevents/pressreleases/monetary20231213a.htm
ii Each of the S&P 500 Index, the S&P 400 Index, the S&P 600 Index, the MSCI EAFE Index, the ICE BofA 1-5 Year Index, the ICE BofA 1-10 Year Index, the ICE BofA 1-12 Year Municipal Bond Index, the Dow Jones Industrial Average, and the NASDAQ Composite (each, an “Index”) is an unmanaged index of securities that is used as a general measure of market performance. The performance of an Index is not reflective of the performance of any specific investment. Each Index comparison is provided for informational purposes only and should not be used as the basis for making an investment decision. Further, the performance of your account and each Index may not be comparable. There may be significant differences between the characteristics of your account and each Index, including, but not limited to, risk profile, liquidity, volatility and asset comparison. The performance shown for each Index reflects no adjustment for client additions or withdrawals, and no deduction for fees or expenses. Accordingly, comparisons against the Index may be of limited use. Investments cannot be made directly into an Index.
iii https://www.bea.gov/news/2023/personal-income-and-outlays-november-2023
iv Five Star Wealth Manager Award program, managed by fivestarprofessional.com ("FSP"), conducts market-specific research throughout the U.S. and Canada to select reputable, specialized, and honest service professionals. This award is for the time period 1/9/23 through 7/31/23. Award candidates that satisfied 10 objective criteria were named 2022 Five Star Wealth Managers. Required Eligibility Criteria: 1. Credentialed as a registered investment adviser (RIA) or a registered investment adviser representative; 2. Actively licensed as a RIA or as a principal of a registered investment adviser firm for a minimum of five years; 3. Favorable regulatory and complaint history review; 4. Fulfilled their firm review based on internal standards; and 5. Accepting new clients. Additional Evaluation Criteria: 1. One-year client retention rate; 2. Five-year client retention rate; 3. Non-institutional discretionary and/or non-discretionary client assets administered; 4. Number of client households served; and 5. Education and professional designations. FSP does not evaluate quality of services provided to clients. The award is not indicative of the wealth manager’s future performance. Neither WFS nor any of its employees paid FSP to be considered or placed on the final list of Five Star Wealth Managers.
v To arrive at the names of the area’s top financial advisers — the fee-only financial planners, fee-based advisers, estate attorneys, tax accountants, and insurance advisers marked with a “best adviser” tag — the Washingtonian distributed surveys to hundreds of people who work in the local financial industry, asking them whom they would trust with their own money. Washingtonian also did their own research, consulting industry experts and publications. The “best adviser” names on this list are the people who received the strongest recommendations. Firms do not pay a fee for employees to be considered or placed on the final list of “Top Fee-Only Financial Planners” or “best adviser.”
West Financial Services, Inc. (“WFS”) offers investment advisory services and is registered with the U.S. Securities and Exchange Commission (“SEC”). SEC registration does not constitute an endorsement of the firm by the SEC nor does it indicate that the firm has attained a particular level of skill or ability. You should carefully read and review all information provided by WFS, including Form ADV Part 1A, Part 2A brochure and all supplements, and Form CRS. The information contained herein does not constitute investment advice or a recommendation for you to purchase or sell any specific security. You are solely responsible for reviewing the content and for any actions you take or choose not to take based on your review of such content.
This information is intended to be educational in nature, and not as a recommendation of any particular strategy, approach, product or concept. These materials are not intended as any form of substitute for individualized investment advice. The discussion is general in nature, and therefore not intended to recommend or endorse any asset class, security, or technical aspect of any security for the purpose of allowing a reader to use the approach on their own. Certain information contained herein was derived from third party sources as indicated. While the information presented herein is believed to be reliable, no representation or warranty is made concerning the accuracy of any information presented. We have not and will not independently verify this information. Where such sources include opinions and projections, such opinions and projections should be ascribed only to the applicable third party source and not to WFS.
Certain statements herein reflect projections or opinions of future financial or economic performance. Such statements are “forward-looking statements” based on various assumptions, which may not prove to be correct. No representation or warranty can be given that the projections, opinions, or assumptions will prove to be accurate.